. 2014 Nov 21;3:e03641. doi: 10.7554/eLife.03641

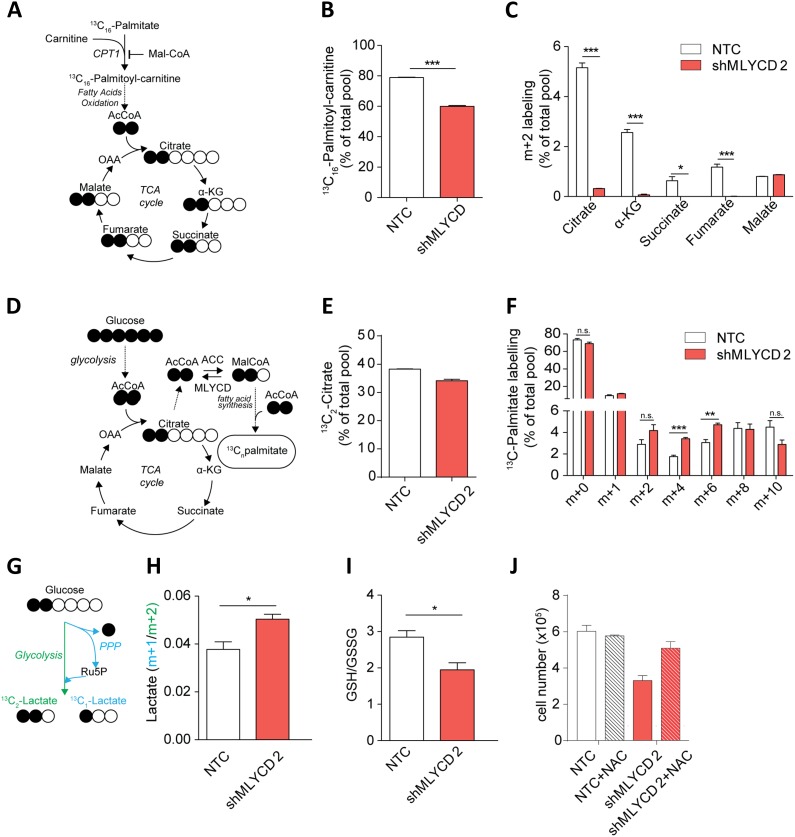
Figure 5. Metabolic characterization of MLYCD depletion.

(A) Schematic representation of isotope tracing experiment with 13C16-Palmitate. Black-filled circles indicate 13C-carbon, whereas the white filled circles represent the unlabeled carbon. The schematic shows the expected composition of labeled carbons of the indicated metabolites. (B) Labeling incorporation from 13C-Palmitate into Palmitoyl-carnitine in non-targeting control (NTC) and MLYCD-depleted (shMLYCD) cells. Data are shown as percentage of 13C16-palmitoylcarnitine to the total pool of Palmitoyl-carnitine. (C) Labeling incorporation from 13C16-palmitate into TCA cycle intermediates of the indicated cell lines. Data are shown as percentage of the m+2 isotopologue to the total pool size of each metabolite. (D) Schematic representation of isotope tracing experiment with 13C6-Glucose. The distribution of light and heavy carbons is depicted as in A. (E) Labeling of Citrate and of (F) Palmitate after incubation with 13C6-glucose. Data are shown as percentage of the indicated isotopologue to the total pool size of each metabolite. Isotopologue distribution of citrate is indicated in Figure 5—figure supplement 6. Palmitate isotopologues above m+10 were not detected (G) Schematic representation of isotope tracing experiment with 1,2-13C2-Glucose. Ru5p: ribulose-5-phosphate. The distribution of light and heavy carbons is depicted as in A. (H) Ratio between m+1 and m+2 isotopologues of Lactate in the indicated cell lines. (I) Ratio between reduced (GSH) and oxidized (GSSG) glutathione in RPMI-8226 cells infected with the indicated constructs. (J) Cell counts after 72 hr of culture of the indicated cell lines in the presence or absence of 2 mM N-Acetyl Cysteine. Data are shown as mean ± s.e.m of three independent cultures. *p-value<0.05. **p-value<0.01. ***p-value < 0.001.

DOI: http://dx.doi.org/10.7554/eLife.03641.010

Figure 5.

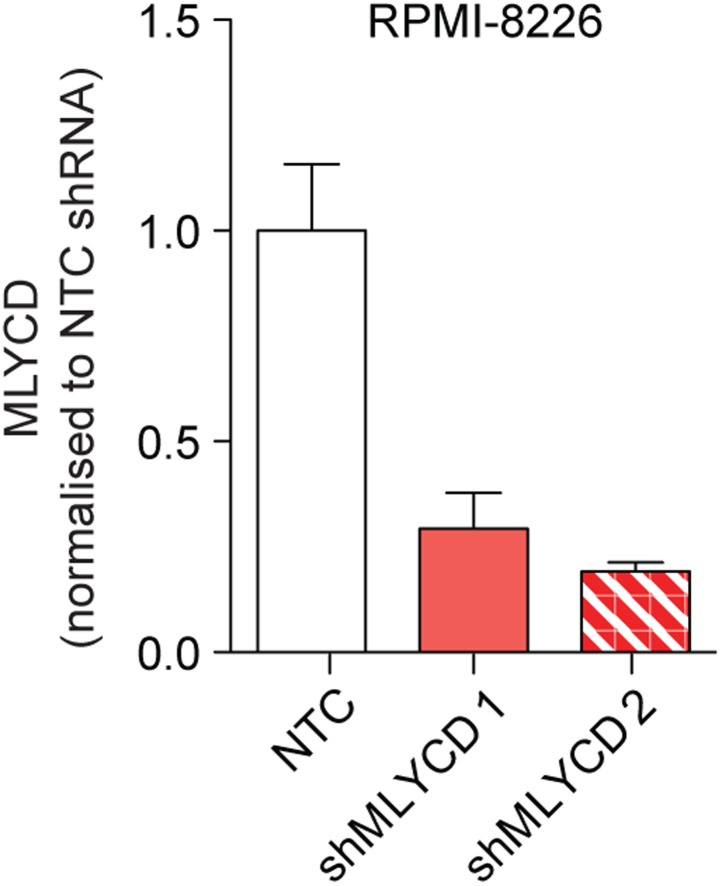
Figure 5—figure supplement 1. Silencing of MLYCD in RPMI-8226 cells using shRNA.

Figure 5—figure supplement 1.

MLYCD mRNA expression upon infection with Non Targeting Control (NTC) and two independent shRNA constructs targeting MLYCD (shMLYCD1 and 2) in RPMI-8226 cells.
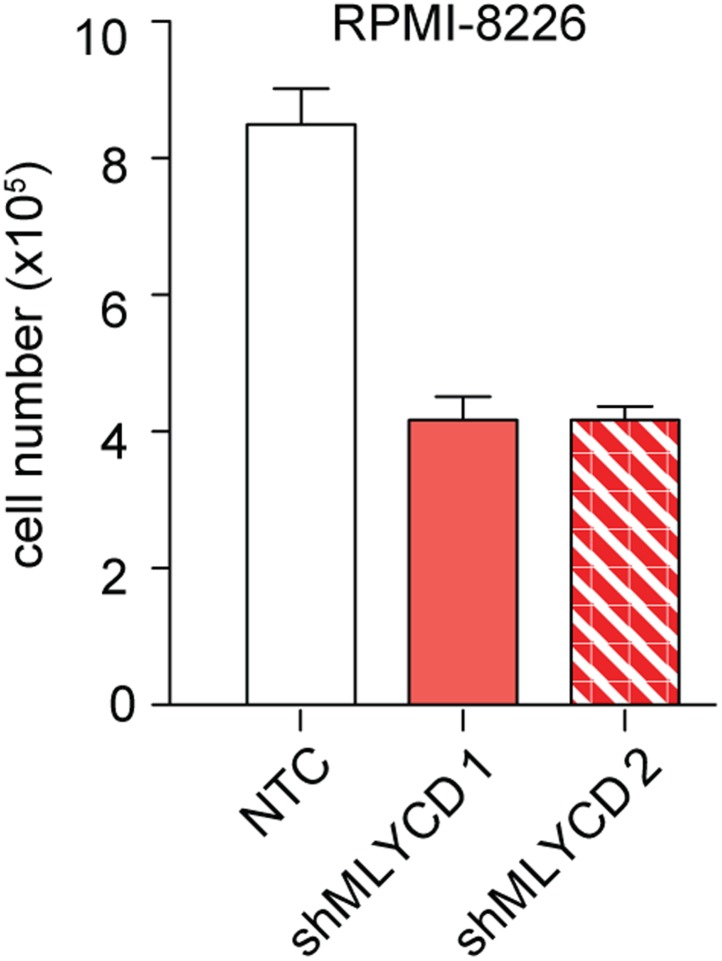
Figure 5—figure supplement 2. Effects of Silencing of MLYCD in RPMI-8226 cells.

Figure 5—figure supplement 2.

Cells were treated as indicated in Figure 5—figure supplement 1 and counted after 72 hr of culture were.
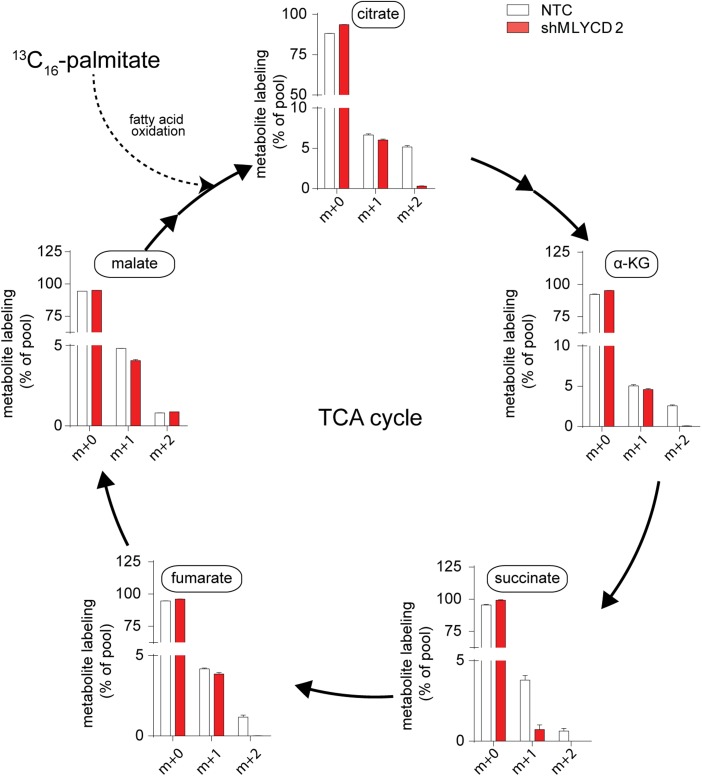
Figure 5—figure supplement 3. Isotopologue distribution of TCA cycle intermediates after incubation with 13C16-palmitate.

Figure 5—figure supplement 3.

Labeling incorporation from 13C16-palmitate in NTC and shMLYCD2 cells. Isotopologues above m+2 were not detected. Data are presented as percentage of the indicated isotopologue to the total pool of each metabolite. Data are presented as mean ± s.e.m.
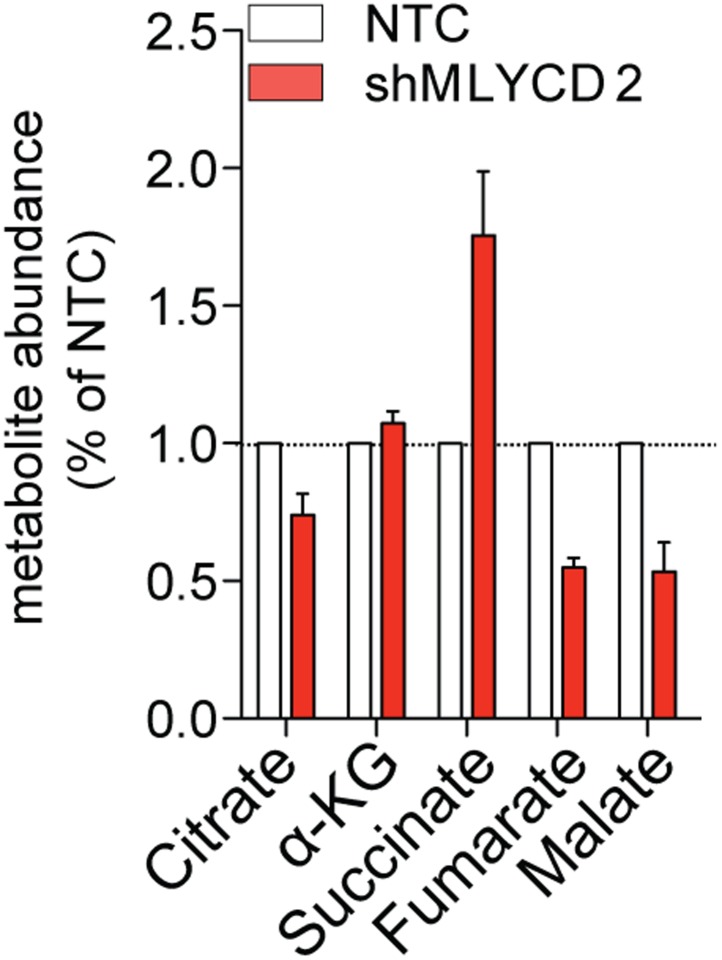
Figure 5—figure supplement 4. LCMS analyses of TCA cycle intermediates in MLYCD-depleted cells.

Figure 5—figure supplement 4.

Total levels of TCA cycle intermediates in RPMI-8226 cells infected with NTC or shMLYCD2. Data are presented as relative abundance of total metabolites in shMLYCD2 compared to NTC.
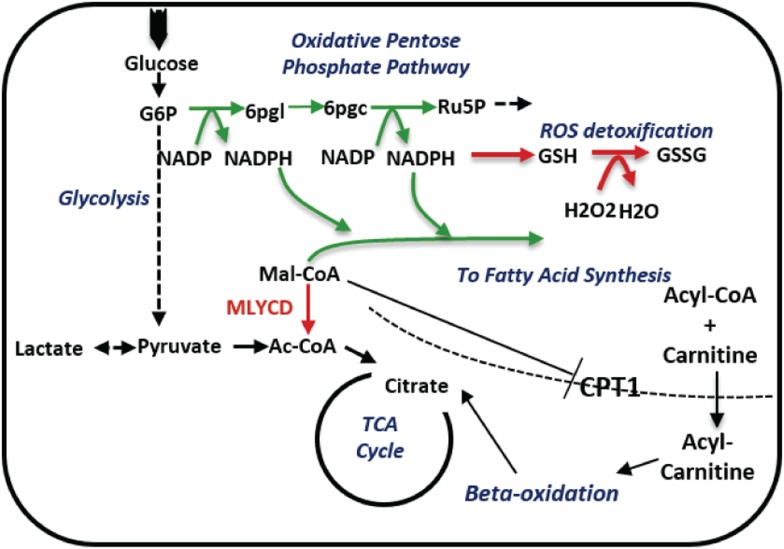
Figure 5—figure supplement 5. A schematic description of the metabolic changes following MLYCD knock down.

Figure 5—figure supplement 5.

MLYCD suppression is predicted to divert the accumulated malonyl-CoA to fatty acid biosynthesis, increasing the demand of cells for reducing power. The latter is generated by the oxidative branch of the pentose phosphate pathway, overall leading to increased oxidative stress. Green/red arrows represent increased/decreased flux, respectively.
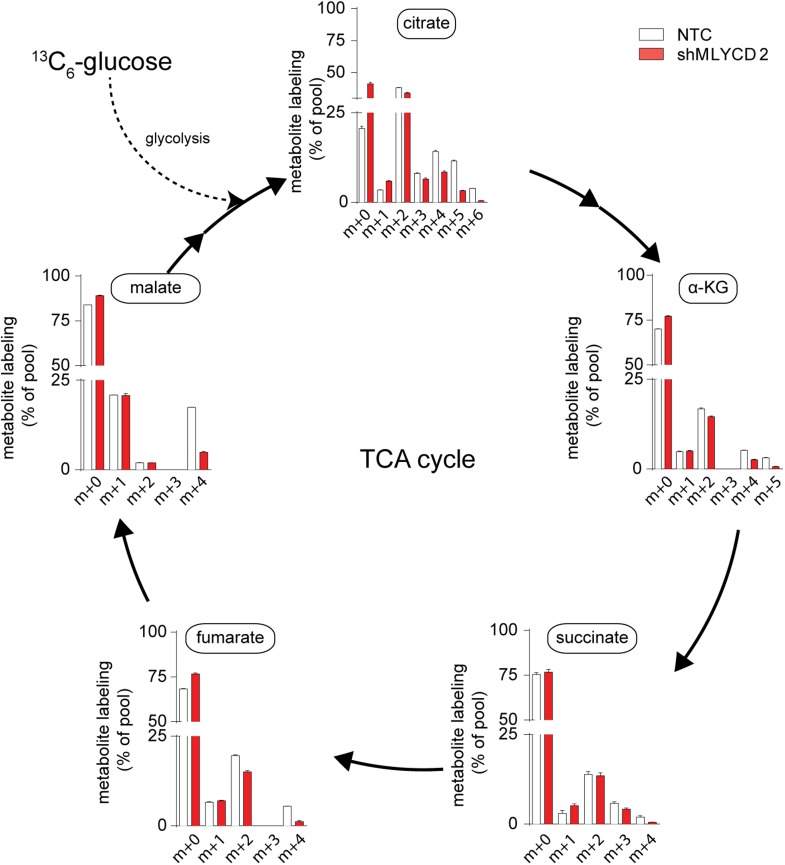
Figure 5—figure supplement 6. TCA cycle activity in MLYCD-depleted cells.

Figure 5—figure supplement 6.

Labeling incorporation from 13C6-Glucose in NTC and shMLYCD2 cells. Data are presented as percentage of the indicated isotopologue to the total pool of each metabolite. Data are presented as mean ± s.e.m.