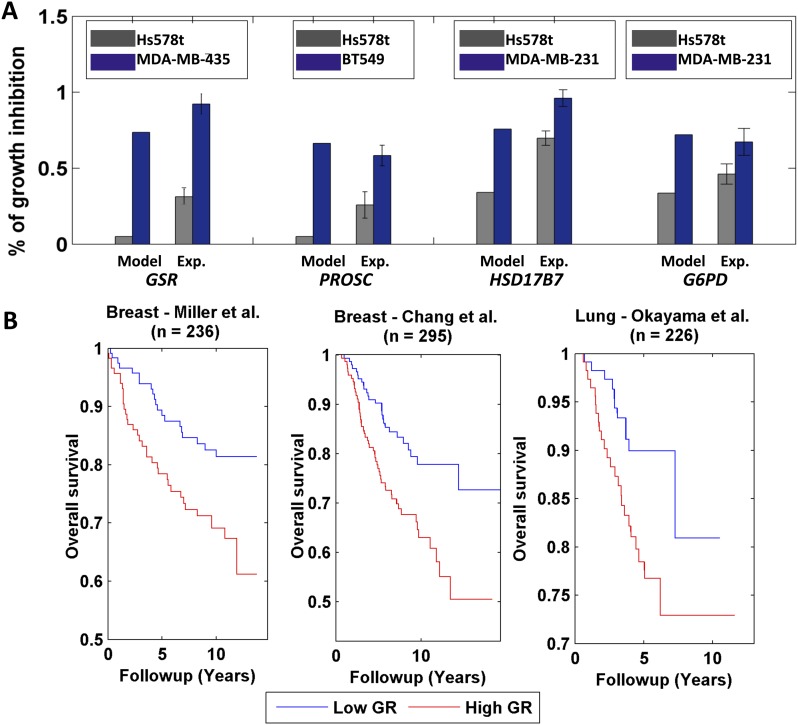
Figure 6. Differential growth affects in breast cancer cell-lines and clinical data analysis.
(A) Four gene/reaction targets showing a differential effect on cancer cell growth (represented as % of growth inhibition) according to both PRIME's predictions and experimental validations via siRNA knock downs (when compared to a negative control, a siRNA that targets luciferase). Each gene was tested experimentally in two cell lines in triplicate, where the gene knock down is predicted to have the lowest and highest effect on cell growth. 11 out of the 13 top predictions tested were confirmed experimentally. Data are shown as mean ± s.e.m. For the full list see Supplementary file 2D. The genes GSR and PROSC are predicted to completely suppress the Hs578 t cell line growth (Supplementary file 2) but for presentation appear with a 0.05% height bar; (B) Kaplan-Meier plots for the two breast cancer datasets and for a lung cancer dataset. In all cases low growth rate (GR) is associated with improved survival.

