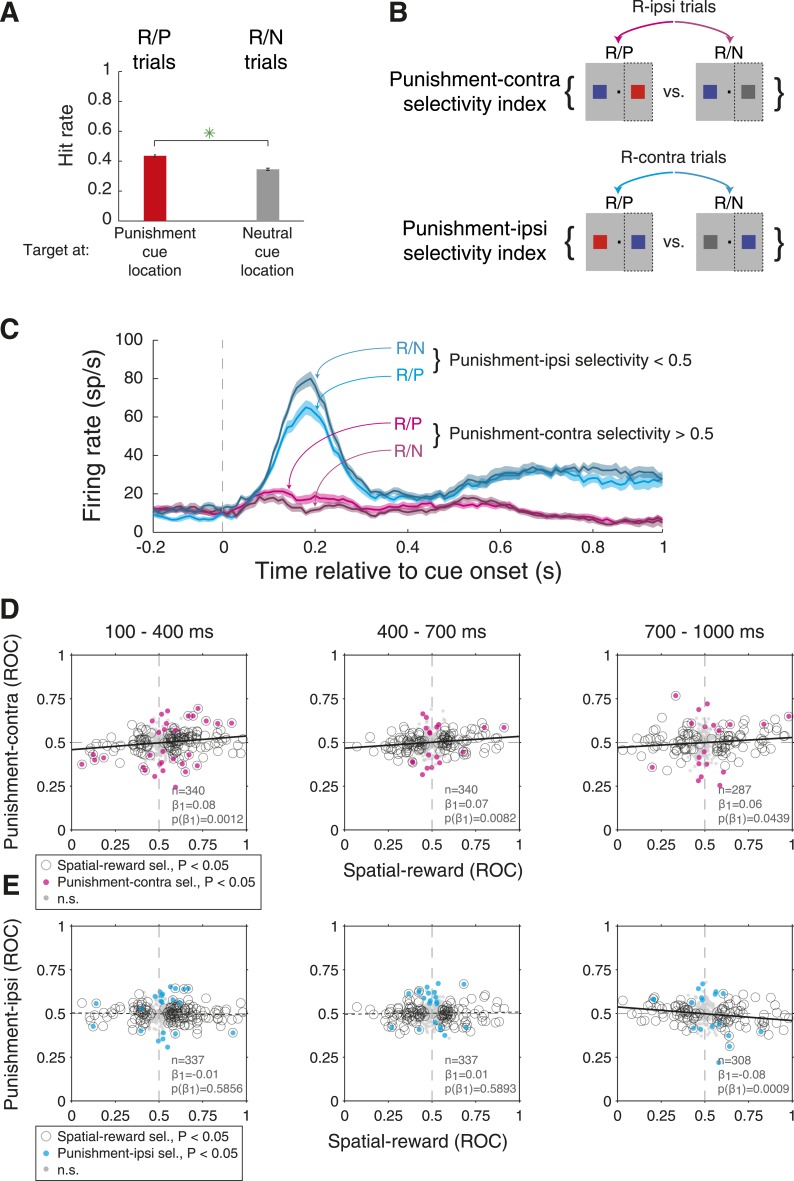
Figure 5. Amygdala neurons reflect subtle changes in attention on R-present trials driven by punishment cues.
(A) Hit rates for secondary cues compared across R/P and R/N trials (bottom). Hit rates were greater for the P cue relative to the N cue; green stars indicate significance (p < 0.05). (B) Trial types used to compute punishment-contra and punishment-ipsi selectivity indices and corresponding behavior; dashed rectangles indicate the contralateral hemifield in each comparison. (C) Firing rates of an example neuron on R/P & R/N trials. For this neuron, both punishment-contra and punishment ipsi selectivity were significant (p < 0.05) in the early time window (100–400 ms). (D and E) Relationship between spatial-reward selectivity indices and (D) punishment-contra or (E) punishment-ipsi selectivity indices for each time epoch. Spatial-reward selectivity indices on the x-axis are the same as those on the x-axis of Figure 4B. Plot style indicates the significance of selectivity indices (see legend); solid and dashed regression lines indicate significant (p < 0.05) and non-significant relationships, respectively.

