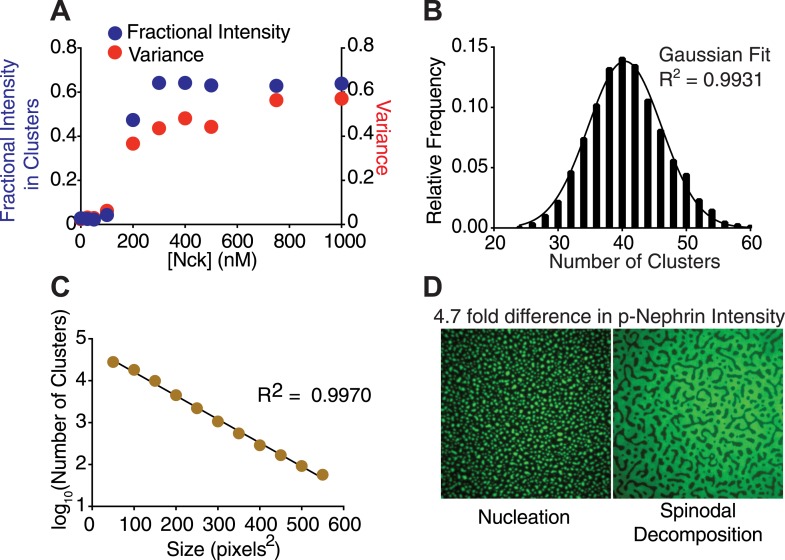
Figure 2. Nephrin clusters are created via a two-dimensional phase-transition.
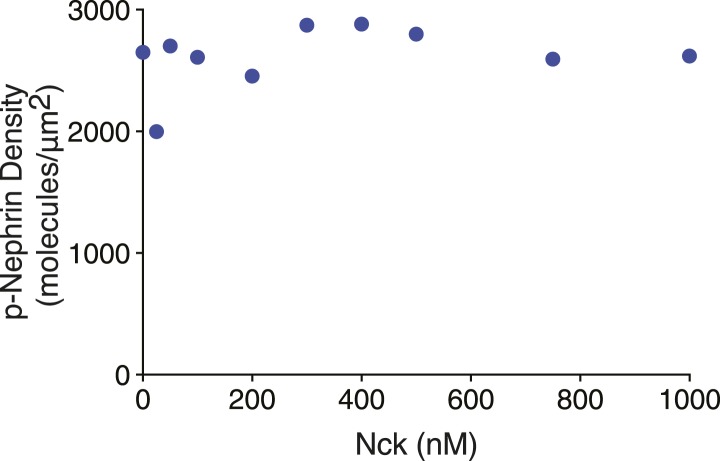
(A) Fractional intensity in clusters (blue symbols, left ordinate) and signal variance (red symbols, right ordinate) of p-Nephrin fluorescence on a DOPC bilayer as a function of Nck concentration for 500 nM N-WASP and total p-Nephrin density of ∼2700 molecules/µm2. (B) Relative frequency with which a given number of clusters are found within 93 randomly selected 56 × 56 µm regions of a bilayer formed using ∼2500 molecules/µm2 Alexa488-labeled p-Nephrin, 1 µM Nck, and 1 µM N-WASP. (C) Size distribution of clusters formed using ∼2500 molecules/µm2 Alexa488-labeled p-Nephrin, 1 µM Nck, and 1 µM N-WASP. (D) Puncta formed using 1 µM Nck, 1 µM N-WASP, and low (left) or 4.7-fold higher (right) density of p-Nephrin. Images were autocontrasted for clarity.


