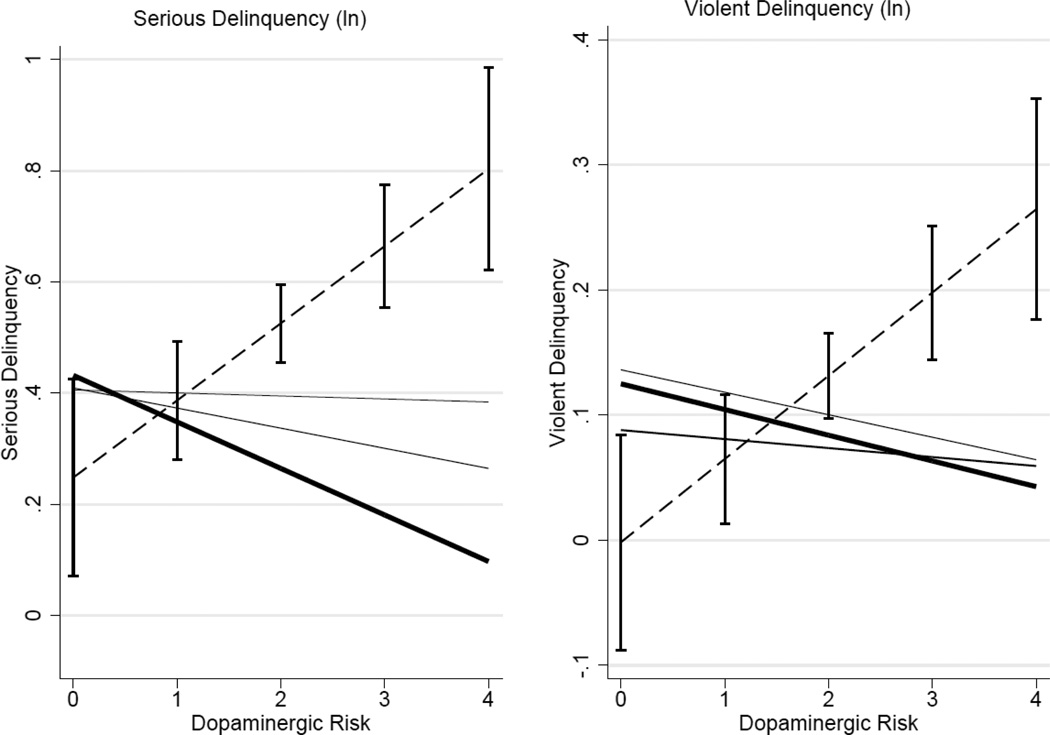
Figure 3. Cumulative genetic and environmental risk for serious and violent forms of delinquency.
Note: Estimates derived from Table 5 using the margins command in STATA 12.0. The dashed line is the lowest level of social control (n=152) and the thick solid line is the highest social control (n=138). Confidence intervals are provided for the high risk group to indicate the significance of the observed difference between high risk and the other groups. In this case, risk is the cumulative number of risky environments. The dashed line describes the estimated effect of increasing number of dopaminergic alleles for those with no social resources from friends, family, neighborhoods, and schools. The solid black line is those who have resources in at least 3 of these domains.

