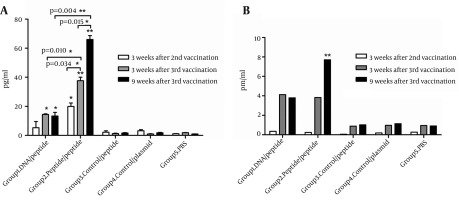
Figure 4. IFN-γ (A) and IL-4 (B) Measurement at Regular Intervals During the Vaccination Schedules.

The comparison between the two indicated groups was significant when * P < 0.05 and ** P < 0.01. The asterisks shown directly above the bars mark the statistically significant difference between vaccinated groups and the related control group of mice.
