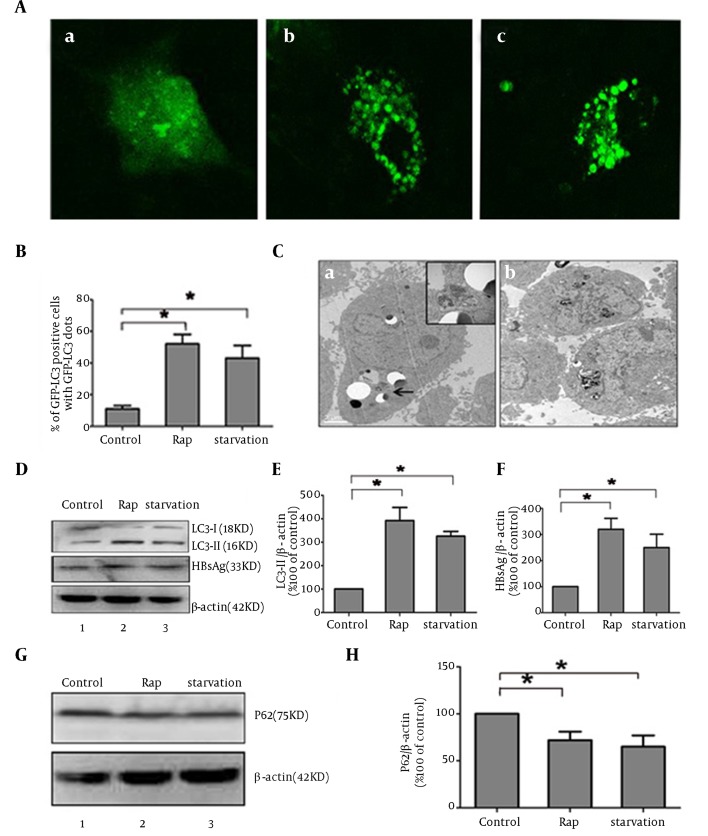
Figure 3. Rapamycin Induced Autophagy Phenomenon in HepG2.2.15.
(A) HepG2.2.15 cells were transfected with pGFP-LC3 and autophagic dots were observed by confocal laser microscopy. (B) Quantitation of the autophagic cells in HepG2.2.15, the cell lines were under treatment of rapamycin of 36 hours, starvation or no treatment (control). (C) Representative electron micrographs of HepG2.2.15 cells under starvation or rapamycin, double membrane organelles and cytoplasmic contain were marked by arrow. (D) HepG2.2.15 cells were treated with rapamycin, starvation or untreated (control) less than 36 hours. The levels of LC3-II and HBsAg protein expression were determined by Western blot analysis. Β-actin expression was examined as a protein loading control. (E) The LC3-II/B-actin ratios were quantified by densitometry analysis using Quantity One software (Bio-Rad). Results represent the mean data from three independent experiments. *, P < 0.05 (F) the HBsAg/B-actin ratios was quantified by densitometry analysis using Quantity One software. Results represent the mean data from three independent experiments.*, P < 0.05. (G) P62 protein expression was determined by Western blot analysis. (H) The P62/B-actin ratio was quantified by densitometry analysis using Quantity One software. Results represent the mean data from three independent experiments. *, P < 0.05.

