
Figure 1.
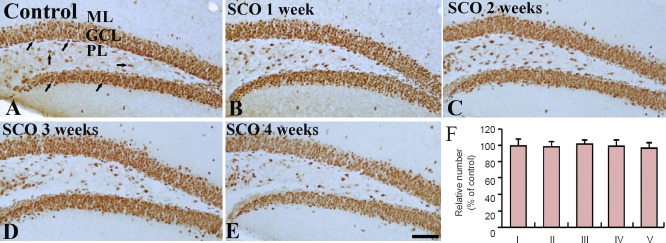
NeuN immunohistochemistry in the dentate gyrus of the control and SCO-treated (1–4 weeks) groups.
In the control group (A), NeuN-positive cells (arrows) are well detected in the hippocampal dentate gyrus. NeuN-positive cells in all the SCO-treated (1–4 weeks) groups (B–E) are similar to those in the control group. Scale bar: 200 μm. (F) The percent of the number of NeuN-positive cells/mm2 in the GCL of the hippocampal dentete gyrus. Data were analyzed using one-way analysis of variance followed by a Tukey's multiple range method (n = 7 per group). The bars indicate the mean ± SEM. SCO: Scopolamine; GCL: granule cell layer; ML: molecular layer; PL: polymorphic layer; I: control; II: SCO 1 week; III: SCO 2 weeks; IV: SCO 3 weeks; V: SCO 4 weeks.