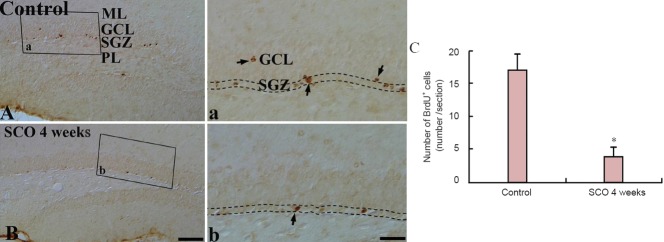
Figure 7.

BrdU immunohistochemistry in the dentate gyrus of the control and 4 weeks-SCO-treated groups.
The number of BrdU-positive cells (arrows) in the SGZ (indicated by dashed wavy lines) of the 4 weeks-SCO-treated group (B, b) is significantly decreased compared with that in the control group (A, a). Scale bars: 200 μm for A, B, and 50 μm for a and b. (C) The mean number of BrdU-positive cells per section in the dentate gyrus. Data were analyzed using an independent samples t-test (n = 7 per group; *P < 0.05, vs. the control group). The bars indicate the mean ± SEM. BrdU: 5-Bromo-2′-deoxyuridine; SCO: scopolamine; ML: molecular layer; GCL: granule cell layer; SGZ: subgranular zone; PL: polymorphic layer.
