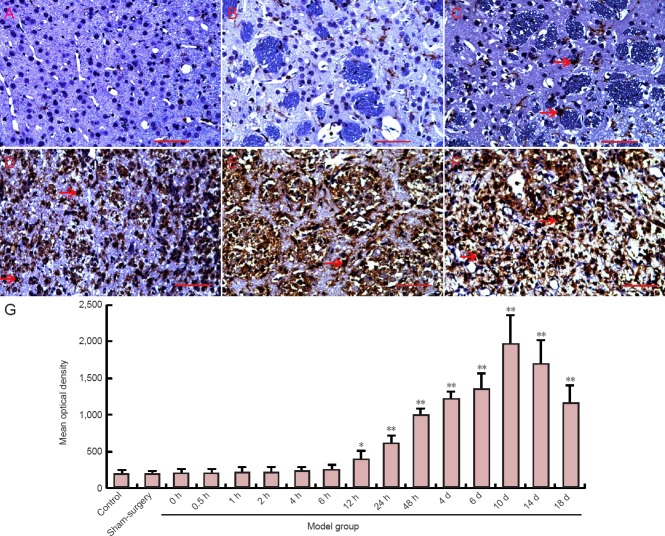
Figure 6.
Changes in microglia in the cerebral ischemic region of rats after middle cerebral artery occlusion (immunohistochemical staining).
(A–F, light microscope, × 400). Iba-1 is a marker of microglia. Cells with yellowish-brown cytoplasm are positive (arrows). (A) Sham surgery group; (B–F) 6, 12 hours, 4, 10, and 18 days after middle cerebral artery occlusion. (G) Immunohistochemistry for microglia (Iba-1-positive cells) in the corpus callosum and striatum. Data are expressed as the mean ± SD. One-way analysis of variance was used to evaluate differences between groups. Paired t-test was applied for intergroup comparison. *P < 0.05, **P < 0.01, vs. sham surgery and control groups. h: hour(s); d: day(s).

