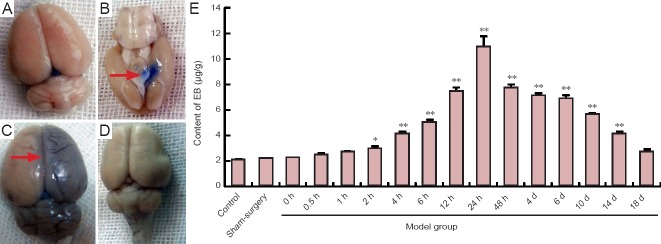
Figure 7.

Alterations in the permeability of the blood-brain barrier in rats after middle cerebral artery occlusion.
(A) Sham-surgery group; (B) Evans blue (EB) accumulation 2 hours after middle cerebral artery occlusion (arrow); (C) EB accumulation (arrow) 24 hours after middle cerebral artery occlusion; (D) 10 days after middle cerebral artery occlusion; (E) EB content at different time points. Data are expressed as the mean ± SD. One-way analysis of variance was used to evaluate differences between groups. Paired t-test was applied for intergroup comparisons. *P < 0.05, **P < 0.01, vs. sham surgery and control groups. h: Hour(s); d: day(s).
