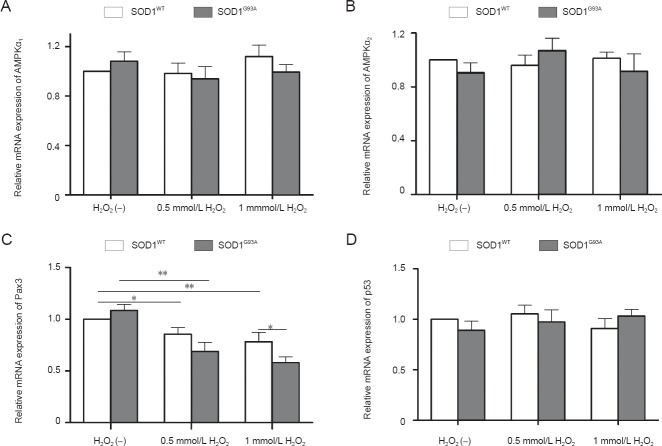
Figure 6.
Quantitative real-time PCR analysis of the mRNA expression of adenosine monophosphate (AMP)-activated protein kinase α1 subunit (AMPKα1) (A), AMP-activated protein kinase α2 subunit (AMPKα2) (B), paired box 3 (Pax3) (C), and p53 (D) in neural stem cells under different treatment conditions.
H2O2 (–): Untreated. *P < 0.05; **P < 0.01. Data are presented as the mean ± SD and analyzed using one-way analysis of variance followed by the least significant difference post-hoc test. SOD1: Superoxide dismutase 1.

