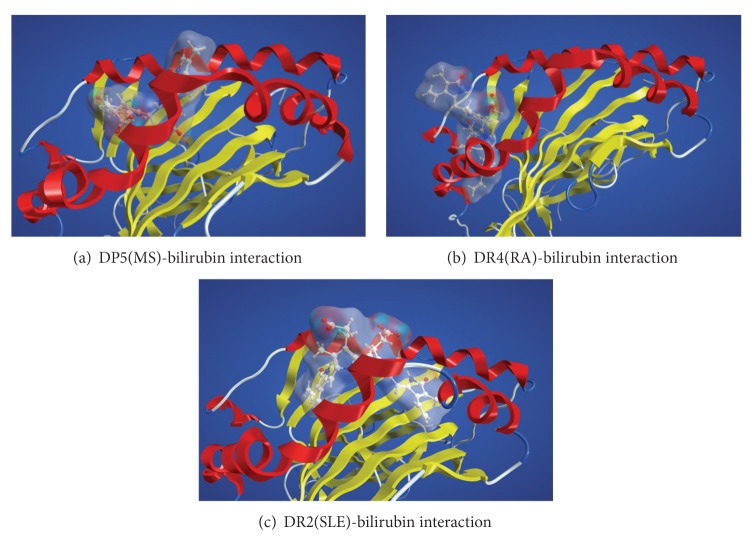
Figure 3.
The binding modes between bilirubin and three disease-associated HLA molecules. The bilirubin molecule is shown by a ball-and-stick model with the molecular surfaces. The HLA molecules are depicted schematically. The alpha helix and beta strand are shown in red and yellow, respectively. (a) The interaction between bilirubin and the HLA DP5 molecules associated with MS (b) the interaction between bilirubin and the HLA DR4 molecules associated with RA, (c) the interaction between bilirubin and the HLA DR2 molecules associated with SLE.

