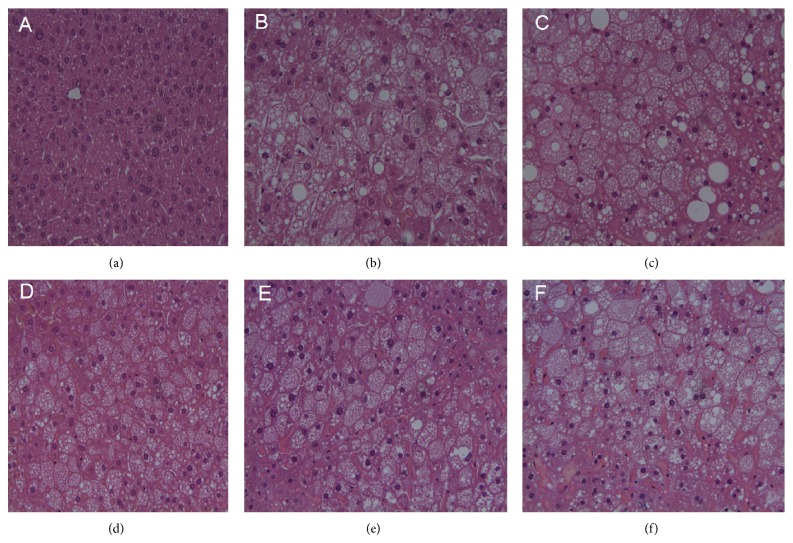
Figure 11.
The pathological examination of liver tissue in db/db mice. (a) Hepatic cellular architecture from a normal mouse. (b) Hepatic cellular architecture from db/db mouse with no treatment shows ballooning degeneration and fatty degeneration of hepatocytes. (c) Microscopic view of degenerated hepatocytes from metformin-treated db/db mouse. (d), (e), and (f) Alleviation of hepatocytes degeneration from pancreatic islet from db/db mouse treated with TNTL at the dose of 3.6 g, 1.8 and 0.9 g/kg b.w., respectively.

