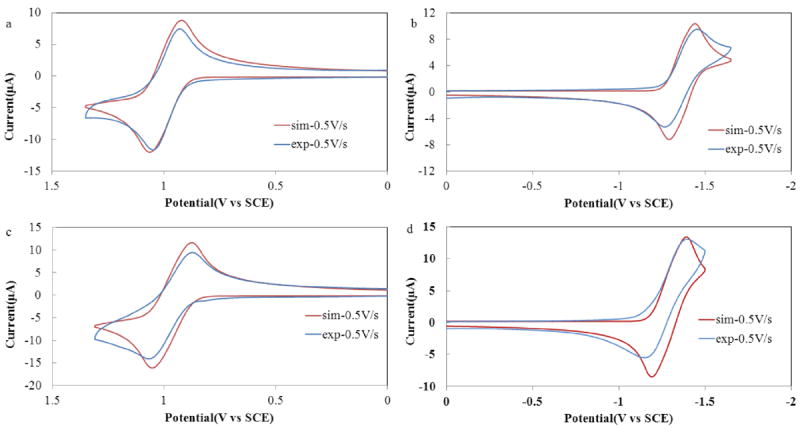
Figure 3.

Comparison between simulated (red) and experimental (blue) polarization curves for (a, b) BB3 and (c, d) BB4. Simulations were prepared for an EE mechanism with a heterogeneous ET rate constant of k° > 0.01 cm/s. Experimental polarization curves recorded in CH2Cl2 containing 0.1 M TBAPF6 with a platinum disk working electrode (A = 0.043 cm2) at a scan rate (ν) of 500 mV/s.
