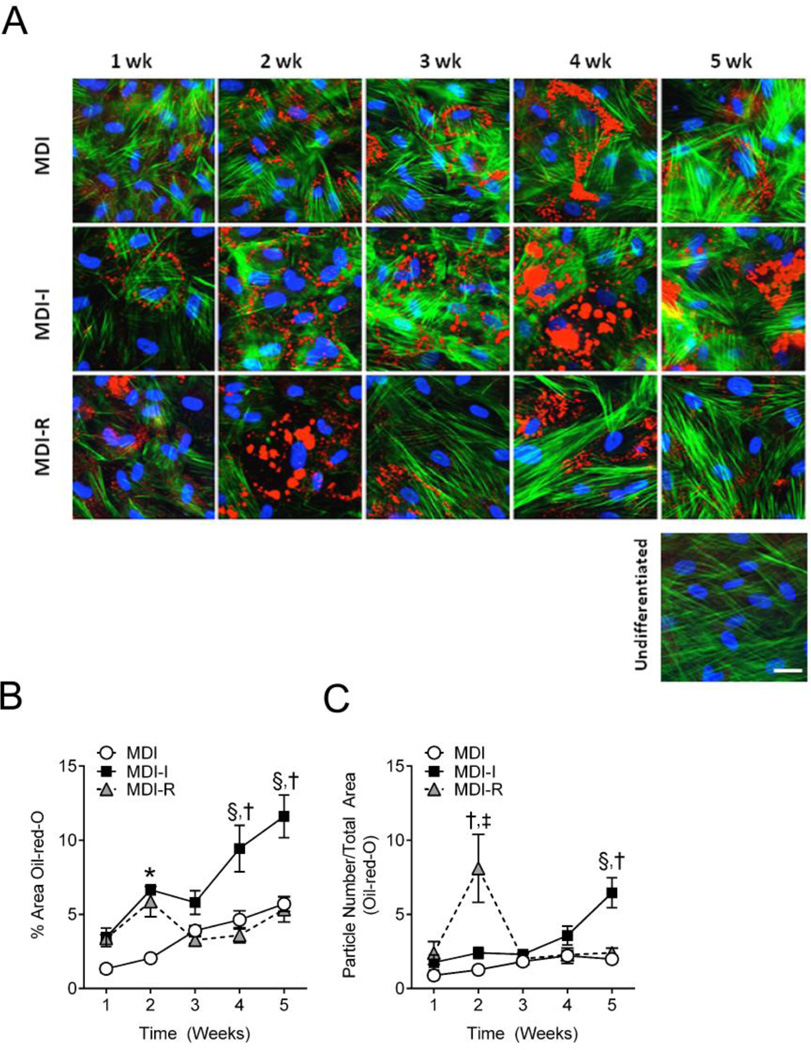
Figure 3. Semi-quantitative analysis of triglyceride accumulation and lipid droplet size in differentiated UCMSCs.
UCMSCs differentiated for 1–5 weeks in MDI (open circle), MDI-I (black square), and MDI-R (gray triangle) were fixed and stained for neutral lipids with Oil-red-O (Red), actin filaments with phalloidin (Green), and DNA with DAPI (Blue). The white calibration bar indicates 10 µm. A: Representative images of differentiated UCMSCs were taken at 40x using fluorescent microscopy. B and C: Masking software (Axiovision) was used to quantify the areas stained red from 4–6 images per group, per time point. B: Triglyceride accumulation was determined as the % Area stained red normalized to the number of nuclei per image. C: Lipid droplet size was determined by dividing the total masked area (red) by the number of particles counted. Values are expressed as mean ± SE. Repeated measures two-way ANOVA with Tukey’s posthoc test was performed to compare treatment groups. For each time point, * represents a significant difference between MDI and both MDI-I and MDI-R, † represents a significant difference between MDI-I and MDI-R, ‡ represents a significant difference between MDI and MDI-R, and § represents a significant difference between MDI and MDI-I (P < 0.05).

