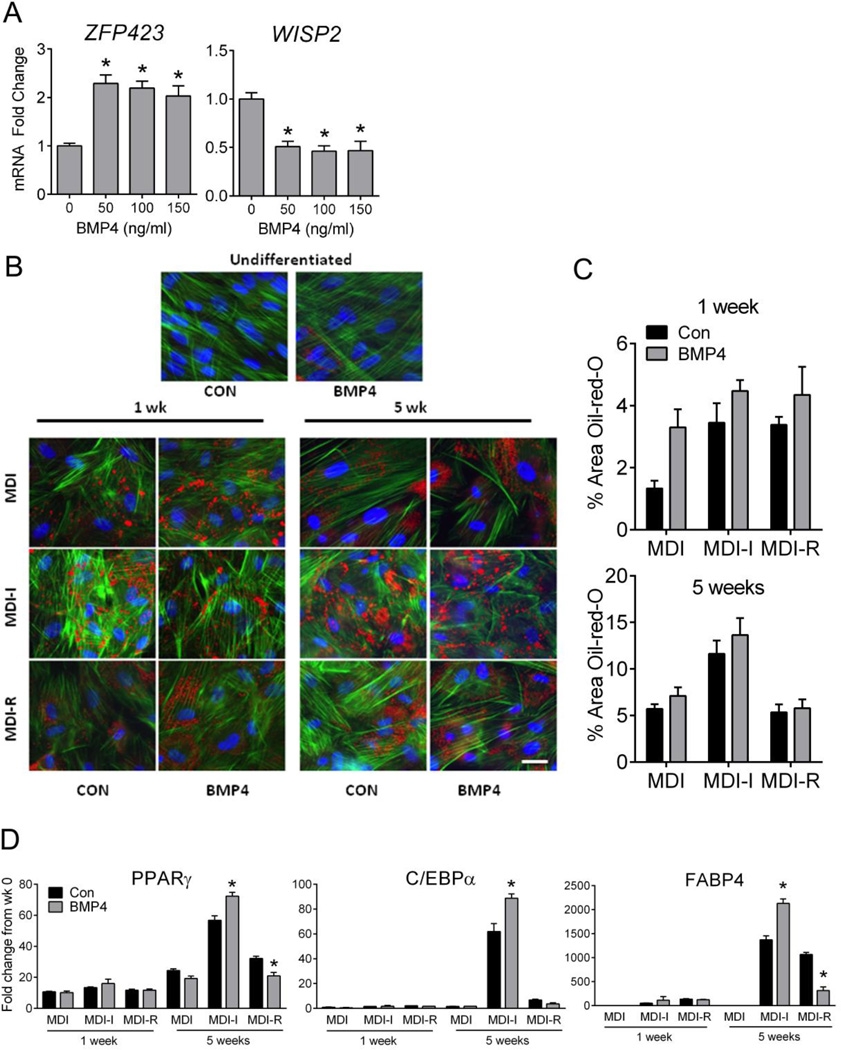
Figure 6. Analysis of adipocyte commitment in UCMSCS via BMP4 stimulation.
UCMSCs were treated with or without BMP4 for 4 days prior to differentiation with MDI, MDI-I, MDI +R. A: Quantitative RT-PCR analysis of WISP2 and ZFP423 mRNA expressions in UCMSCs following increasing doses (50, 100, 150 ng/ml) of BMP4. Values are expressed as the mean fold change from untreated cells (0) ± SE. Significance between 0 and 50, 100, or 150 was determined using one-way ANOVA, followed by Tukey’s posthoc test (* represents a significant difference from untreated cells, P < 0.05). B: Representative, 40x images of UCMSCs treated with (CON) or without BMP4 (100 ng/ml) following adipocyte differentiation for 1 and 5 weeks. Triglyceride = red (Oil-red-O stain), Actin = green (phalloidin stain), Nuclei = blue (DAPI stain). The white calibration bar indicates 10 µm. C: Semi-quantitative analysis of triglyceride accumulation using masking software (Axiovision) as described in Methods. Values are expressed as mean % Area ± SE following normalization to number of nuclei. A repeated measures two-way ANOVA was used to compare CON (black bar) and BMP4 (gray bar) groups for cells differentiated with MDI, MDI-I, or MDI-R (P < 0.05). D: Quantitative RT-PCR analysis of PPARγ, C/EBPα, and FABP4 mRNA expressions in UCMSCs treated with (CON) or without BMP4 (100 ng/ml) prior to differentiation. Values are expressed as the mean fold change from untreated cells (0 week) ± SE. Significant differences were determined by repeated measures two-way ANOVA followed by Sidak’s multiple comparisons test. * represents a significant difference (P < 0.05) between CON (black bars) and BMP4 (gray bars) at each time point under the varying differentiation conditions (MDI, MDI-I, or MDI-R) (P < 0.05).

