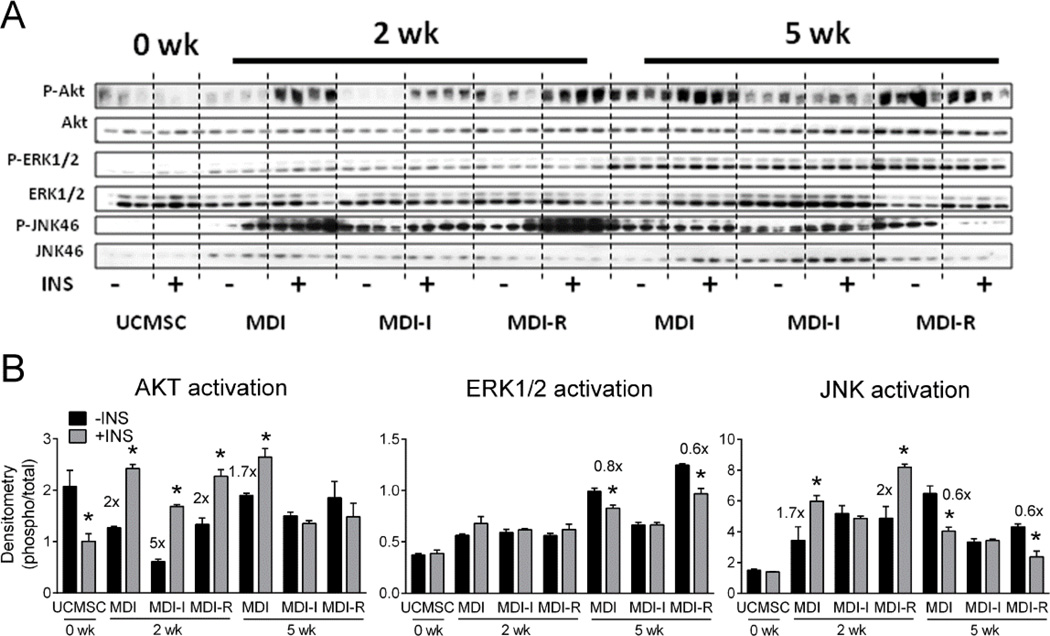
Figure 7. Analysis of AKT, ERK1/2 and JNK activation in differentiated UCMSCs following insulin challenge.
UCMSCs differentiated with MDI, MDI-I, or MDI-R for 2 and 5 weeks were serum starved overnight and stimulated with (+INS) or without (-INS) 100 nM insulin for 10 min. Protein levels of phosphorylated (P-) and total AKT, ERK1/2, and JNK were analyzed via immunoblotting. A: Images of immunoblots probed for P-AKT, AKT, P-ERK1/2, ERK1/2, P-JNK, JNK, and α-tubulin. B-D: Densitometric analysis of (B) AKT, (C) ERK1/2, and (D) JNK levels normalized to α-tubulin. Values are expressed as the mean ratio of phosphorylated to total protein ± SE. Significant differences were determined by repeated measures two-way ANOVA followed by Sidak’s multiple comparisons test. * represents a significant difference (P < 0.05) between -INS (black bar) and +INS (gray bar) at each time point under the varying differentiation conditions (MDI, MDI-I, or MDI-R).

