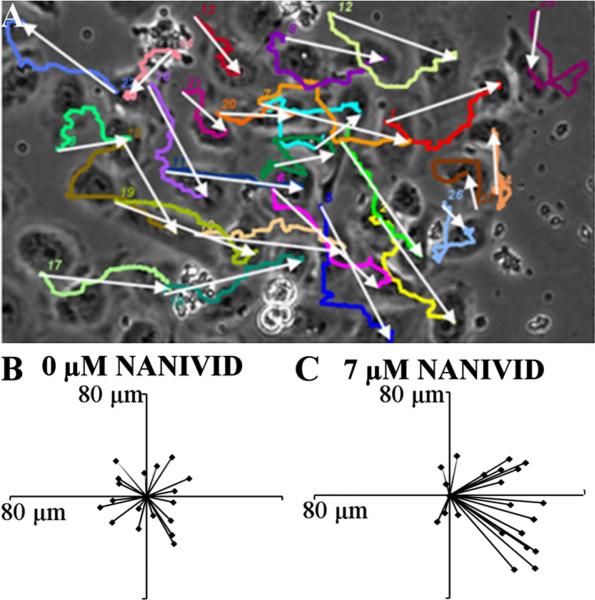
Fig. 3.
Vector plots of MTLn3 MenaInv cells responding to the EGF gradient from the device. (a) A representative image of final frame of the tracked cells in EGF gradient, with the device on the right side (not shown). White arrows represent the displacement of the cells and color lines (see online version) are the paths traveled by these cells. (b) and (c) Vector plots of the cells from the control and 7 μM device experiment, in which all the vectors were superimposed at the common origin.

