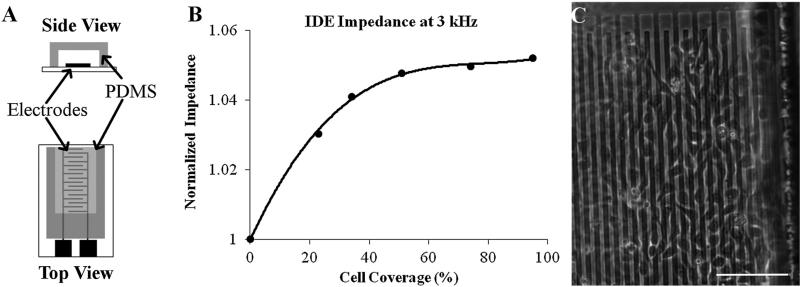
Fig. 6.
(a) Side and top views of the encapsulated electrodes used in this experiment. (b) The normalized real impedance of MTLn3 MenaInv cells on ITO interdigitated electrodes. The plot shows the relationship between the impedance change and the percent cell coverage area. (c) An optical image showing the cell attachment on the electrodes. The scale bar is 100 μm.

