
Figure 2.
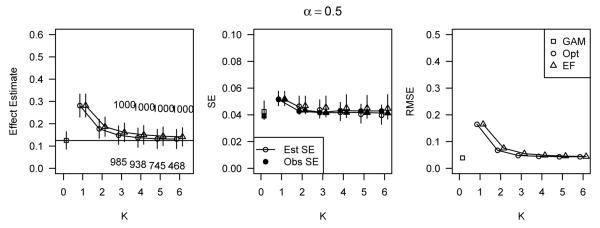
Simulation results for data simulated under the additive model with α = 0.5 and covariate-outcome relations (B), corresponding to h1(x) = 0.25x and h2(x) = 0.025(x + x3).
Official websites use .gov
A
.gov website belongs to an official
government organization in the United States.
Secure .gov websites use HTTPS
A lock (
) or https:// means you've safely
connected to the .gov website. Share sensitive
information only on official, secure websites.
Simulation results for data simulated under the additive model with α = 0.5 and covariate-outcome relations (B), corresponding to h1(x) = 0.25x and h2(x) = 0.025(x + x3).