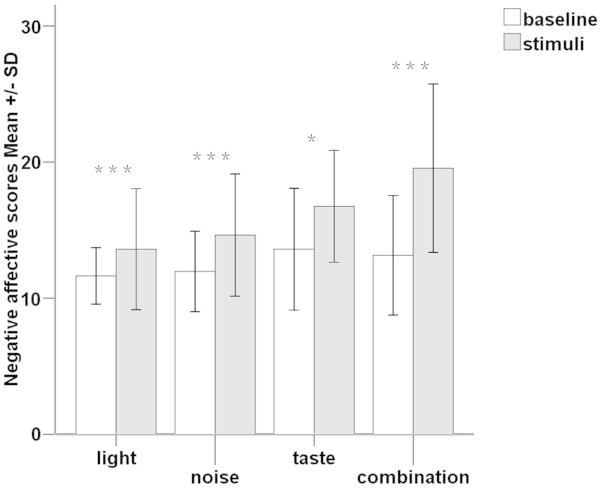
Figure 3.

Negative affective state differences between tests with conditioning stimuli (grizzle bars) and corresponding baselines (white bars). The results are presented as means ± SDs of the negative affective scores form Positive and Negative Affect Schedule. The conditioning stimuli induced statistically significantly higher negative affective states compared with baseline. ***= P <0.001, * = P <0.05.
