
FIGURE 3.
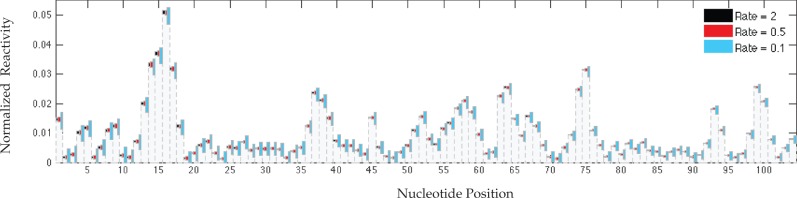
MLE variation at different SHAPE-Seq hit kinetics. Normalized target reactivities are shown in gray bars, with colored boxes representing variation around them. Box boundaries mark tenth and ninetieth percentiles of the empirical MLE distribution.