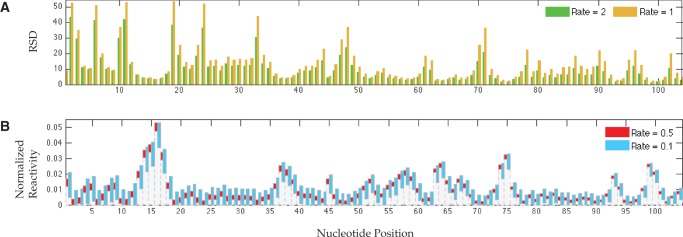
FIGURE 4.

MLE variation following a 10-fold reduction in SHAPE-Seq sequencing volume from 4 × 10⁶ to 4 × 10⁵ reads. (A) RSD values at high hit kinetics. (B) Tenth and ninetieth percentiles of empirically assessed MLE distribution at low-hit kinetics.
