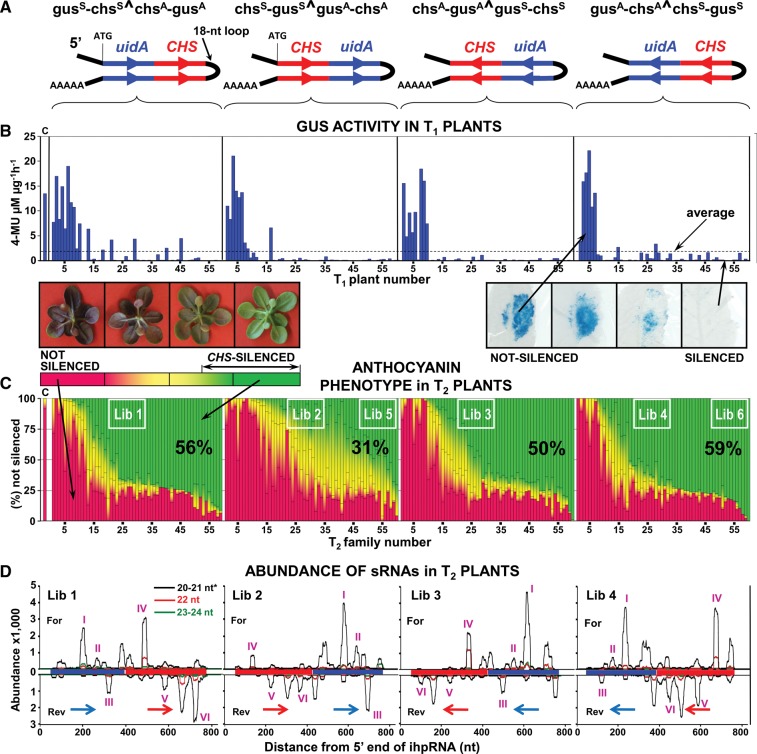
FIGURE 1.
Phenotypes and sRNA profiles in transgenic Arabidopsis ecotype Ws-0 transformed with four constructs configured to produce different ihpRNAs. (A) Predicted ihpRNA structures produced by expression from the integrated T-DNA. (B) Expression of β-glucuronidase in the leaves of transgenic T1 plants measured after Agrobacterium-mediated transient expression of the uidA (GUS) gene. Each bar shows the average GUS activity per T1 plant. (C) Percentage of T2 plants derived from each T1 plant shown in (B) sorted into four classes depending on anthocyanin production: (red) not silenced, (red-yellow) weakly silenced, (yellow-green) moderately silenced, and (green) strongly silenced. The white rectangle indicates the plants used for construction of sRNA and RNA-Seq libraries. (c) control wild-type plants, Arabidopsis thaliana ecotype Ws-0. Each bar corresponds to 48 or more T2 individuals derived from each T1 plant shown in (B). (D) Abundance of transgene-derived sRNA sequences corresponding to the ihpRNA sequences. Roman numerals (purple) indicate peaks of sRNA accumulation compared between libraries. Abundance of sRNA in 1 million reads per library is shown. (*) 20-nt long sRNA accounted for up to 2% of the 20- to 21-nt ihpRNA-derived sRNA shown in the alignment.

