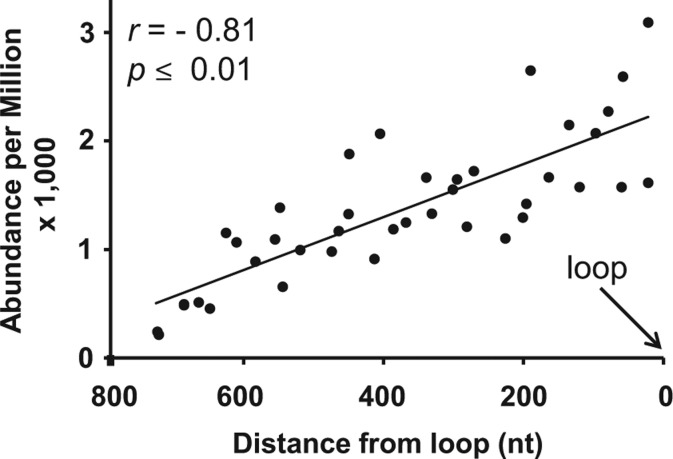
FIGURE 2.
Correlation between the abundance of transcripts in ten major peaks of sRNA production and the position of these peaks in the ihpRNA. The five largest peaks corresponding to the At-CHS and uidA (GUS) fragments were selected and the abundance was calculated for all four sRNA libraries (Libs 1–4). (r) correlation coefficient.

