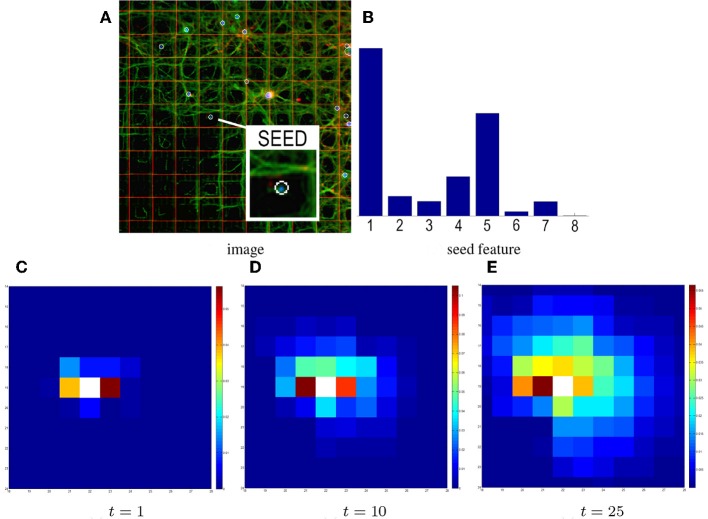
Figure 4.
Influence of time on heat propagation. The heat propagation time directly influences the estimated connectivity. (A) The input image and seed electrode. (B) The corresponding probabilistic directional feature. Higher histogram values in bins #1 and #5 reflect the structure of neurites in the patch (spreading horizontally). (C) Result of the GHK propagation at time t = 1. Electrodes are colored based on the amount of heat propagated from the seed. After time t = 1 the seed feature mainly contributes to the propagation, so electrodes 1 and 5 have warmer colors. (D–E) Results at t = 10, 25. Although the pattern of propagation partially preserves the initial layout, more contributions come from neighboring features.

