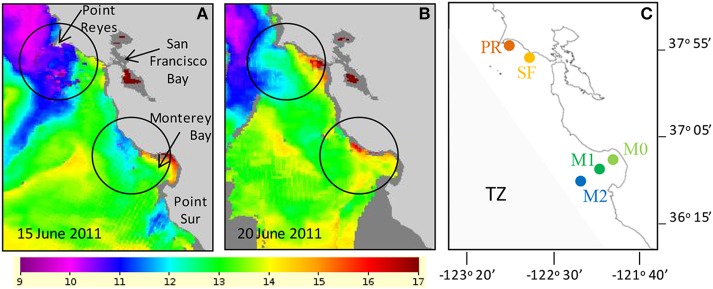
Figure 1.

Sea surface temperature indicated that colder upwelled water was present on June 15 (A) and that upwelling had relaxed and surface water began to warm by June 20 (B). Temperature scale is in °C. Areas of intense upwelling in this study are circled on each map. (C) Map showing the locations where incubation water was collected (see methods for latitude and longitude). Shaded region in (C) indicates the approximate location of the “transition zone” (TZ) described by Biller and Bruland (2014).
