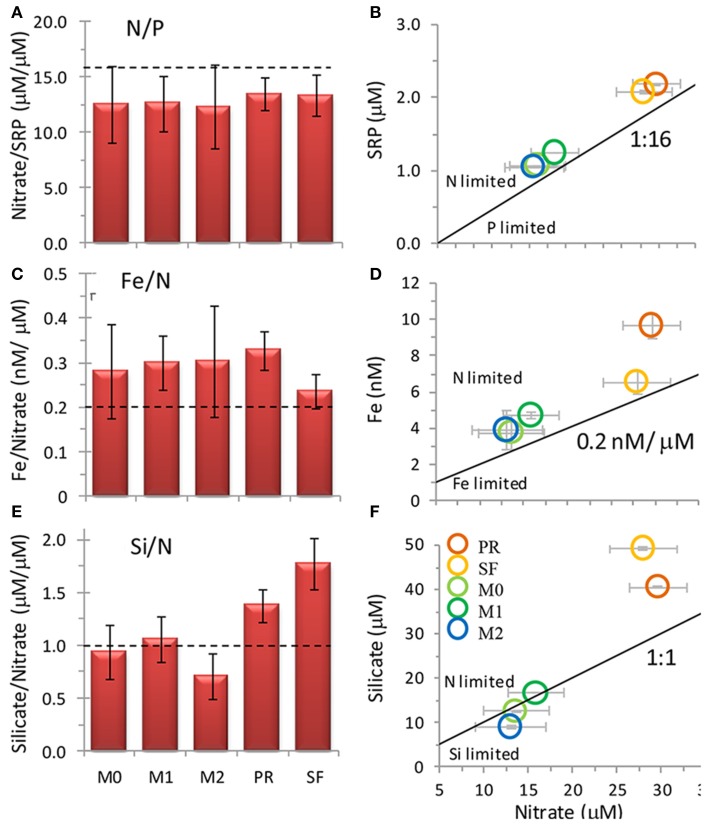
Figure 4.
Nutrient ratios of (A,B) SRP: nitrate, (C,D) Fe: nitrate, and (E,F) silicate: nitrate at the five sampling locations when the incubation water was collected. Legend for (B,D,F shown in F). Error bars show standard deviation. Broken lines in (A,C,E) and solid lines in (B,D,E) show typical ratios of diatom cellular nutrient quotas.

