Figure 6.

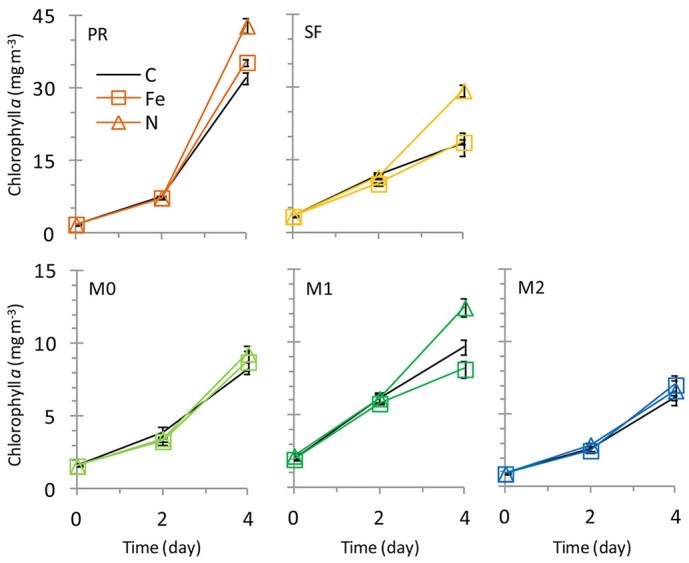
Growth curves showing chlorophyll a over time. Nitrogen additions increased growth at stations PR, SF, and M1. Error Bars show standard error.

Growth curves showing chlorophyll a over time. Nitrogen additions increased growth at stations PR, SF, and M1. Error Bars show standard error.