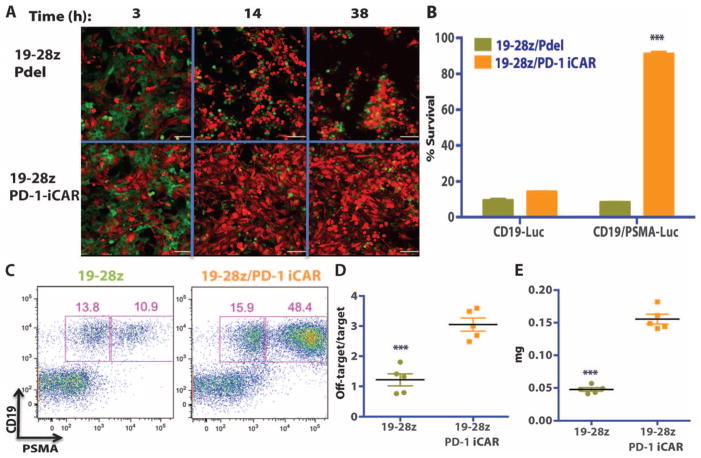
Fig. 8. iCAR- and CAR-expressing T cells discern targets in vitro and vivo.
(A) 19-28z/Pdel or 19-28z/PD-1 iCAR-P T cells were incubated with a 1:1 mix of target (CD19+GFP+, green) and off-target (CD19+PSMA+mCherry+, red) AAPCs, and time-lapse microscopy was used to visualize real-time killing of each population for 38 hours. Representative images are shown, and full-length movies are available in movie S1 (A and B). Scale bars, 0.1 mm. (B) As in (A), 19-28z/Pdel or 19-28z/PD-1 iCAR-P T cells were incubated with a 1:1 mix of target (CD19+) and off-target (CD19+PSMA+) AAPCs. Killing of each AAPC population was assessed in parallel experiments where one of each AAPC type was labeled with CBL (CD19+CBL+/CD19+PSMA+ mix or CD19+/CD19+PSMA+CBL+ mix). Killing was quantified with the Bright-Glo assay system at 38 hours (n = 3 for each condition). (C to E) NOD/SCID/γc− mice were injected with a 1:1 mixture of NALM/6 and NALM/6-PSMA cells and treated with 19-28z or 19-28z/PD-1 iCAR-P T cells. (C) Upon sacrifice, the presence of the target and off-target NALM/6 cells in the bone marrow was analyzed by flow cytometry. (D) Ratio of target/off-target NALM/6 cells in the bone marrow of sacrificed mice was quantified by flow cytometry. (E) Spleen weight of treated mice was also recorded at sacrifice. Error bars represent ±SEM. ***P < 0.001 by Student’s t test.

