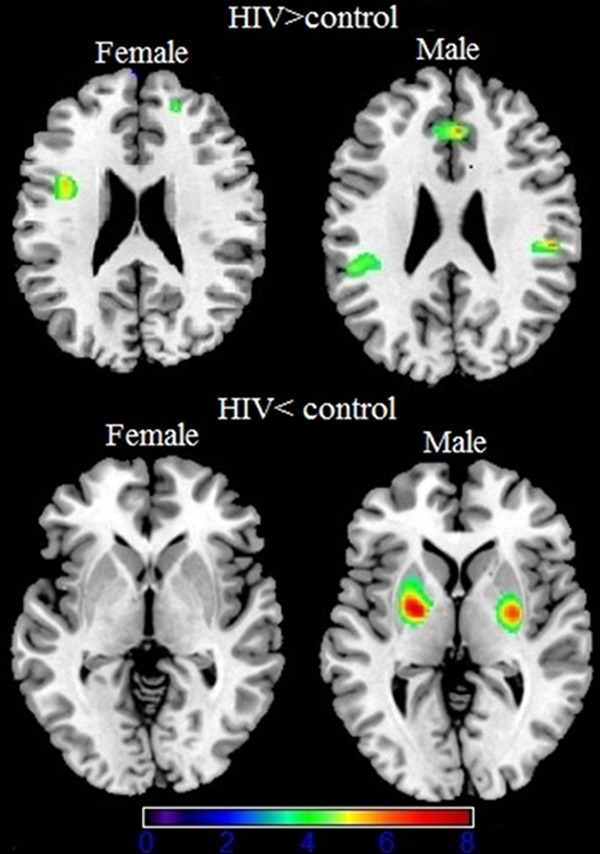
Figure 3.

The first figure is gray matter (green) decreases in female patients with HIV compared to controls. The second is gray matter (green) decreases male patients with HIV compared to controls. The third is gray matter makes no difference in female patients with HIV compared to controls. The forth column is gray matter (green) increases in male patients with HIV compared to controls. (p < 0.001 none corrected for multiple comparisons) are superimposed on an MNI template (Colin brain). Right side of the image is right side of the brain.
