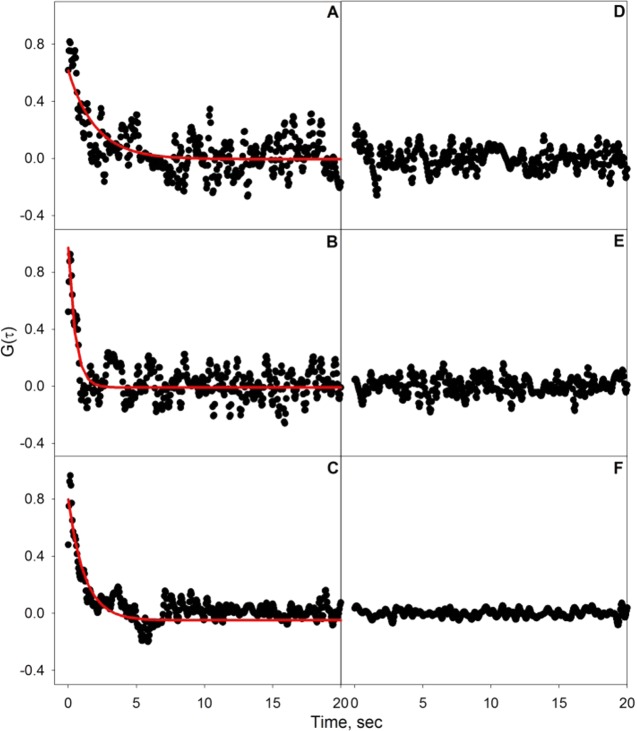
Figure 1.
Autocorrelation data for CTB binding to a 1 mol % GM1-doped DOPC bilayer at CTB concentrations of (A) 0.5, (B) 13, and (C) 240 nM, with fits to eq 1 indicated by the red lines. Also shown are autocorrelations of CTB exposed to a pure DOPC bilayer at (D) 0.5, (E) 13, and (F) 240 nM. Nonspecific CTB autocorrelations have been normalized to the corresponding specific binding data as mentioned in the text.

