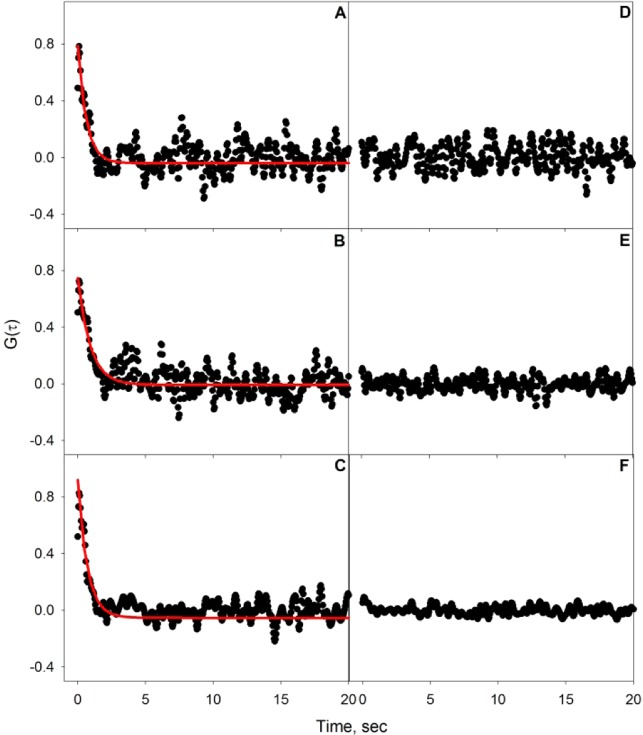
Figure 3.
Autocorrelation data for PnA binding to 5 mol % GM1-doped DOPC bilayer at PnA concentrations of (A) 0.43, (B) 3, and (C) 12 μM, with fits to eq 1 indicated by the red lines. Also shown are the autocorrelations of PnA exposed to a pure DOPC bilayer at concentrations of (D) 0.43, (E) 3, and (F) 12 μM. The nonspecific PnA autocorrelations have been normalized to the corresponding specific binding data as mentioned in the text.

