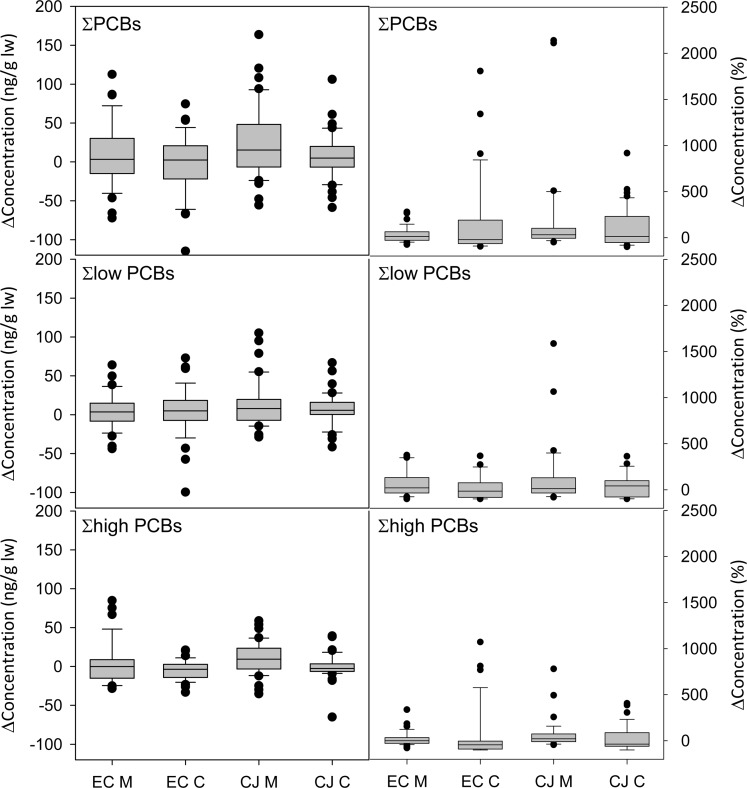
Figure 4.
Change in concentration (left: ng/g lw; right: %) of total, low, and high PCBs, where low PCBs are the sum of homologues 1–5 and high PCBs are the sum of homologues 6–10. A positive value indicates an increase in concentration from year 1 to year 2. EC M and EC C represent East Chicago mothers and children, respectively. CJ M and CJ C represent Columbus Junction mothers and children, respectively.

