
Figure 1.
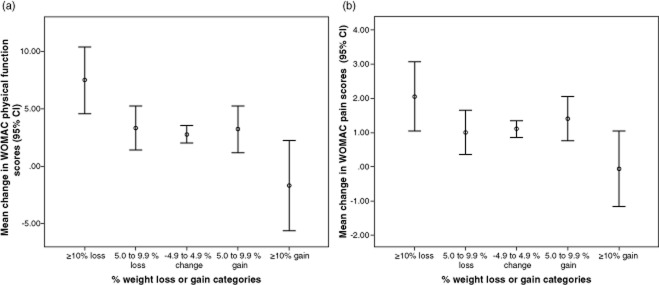
Dose–response relationship for the Western Ontario and McMaster Universities Osteoarthritis Index (WOMAC) physical function (a) and pain (b) scales. Point estimates and 95& confidence interval (95& CI) bars were derived from unadjusted estimates. Reproduced with permission from Riddle DL, Stratford PW. Arthritis Care Res (Hoboken) 2013; 65: 15–22 22