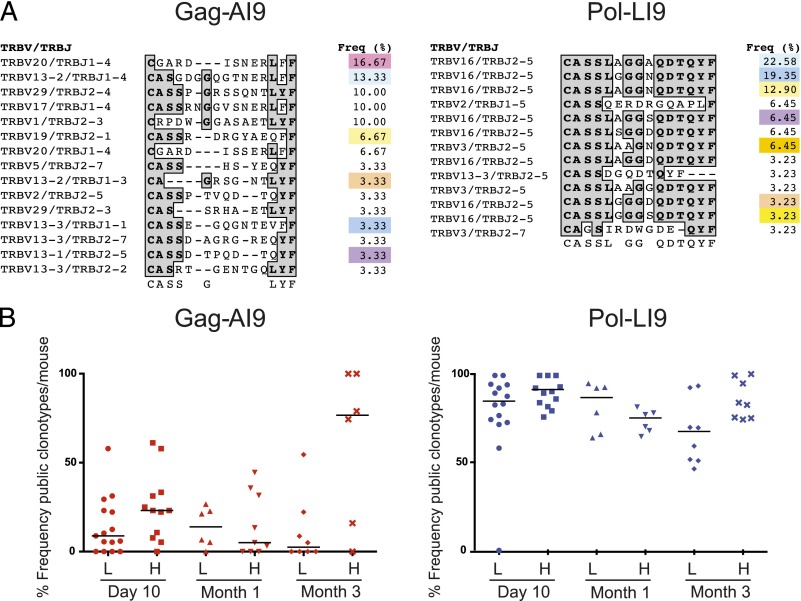
FIGURE 2.
Clonotypic analysis of Ag-specific CD8 T cell populations. (A) Clonotypic analysis of a representative mouse. TRBV and TRBJ usage, CDR3 amino acid sequence, and relative frequency are shown for each clonotype specific for Gag-AI9 (left panel) and Pol-LI9 (right panel). Gray shading denotes consensus amino acids. Colors in the frequency column indicate public clonotypes across the entire cohort. (B) The frequency of public clonotypes per mouse is shown at each time point after vaccination with low-dose (L) or high-dose (H) Ad5.Gag.Pol. Each symbol represents a single tissue site from an individual mouse.

