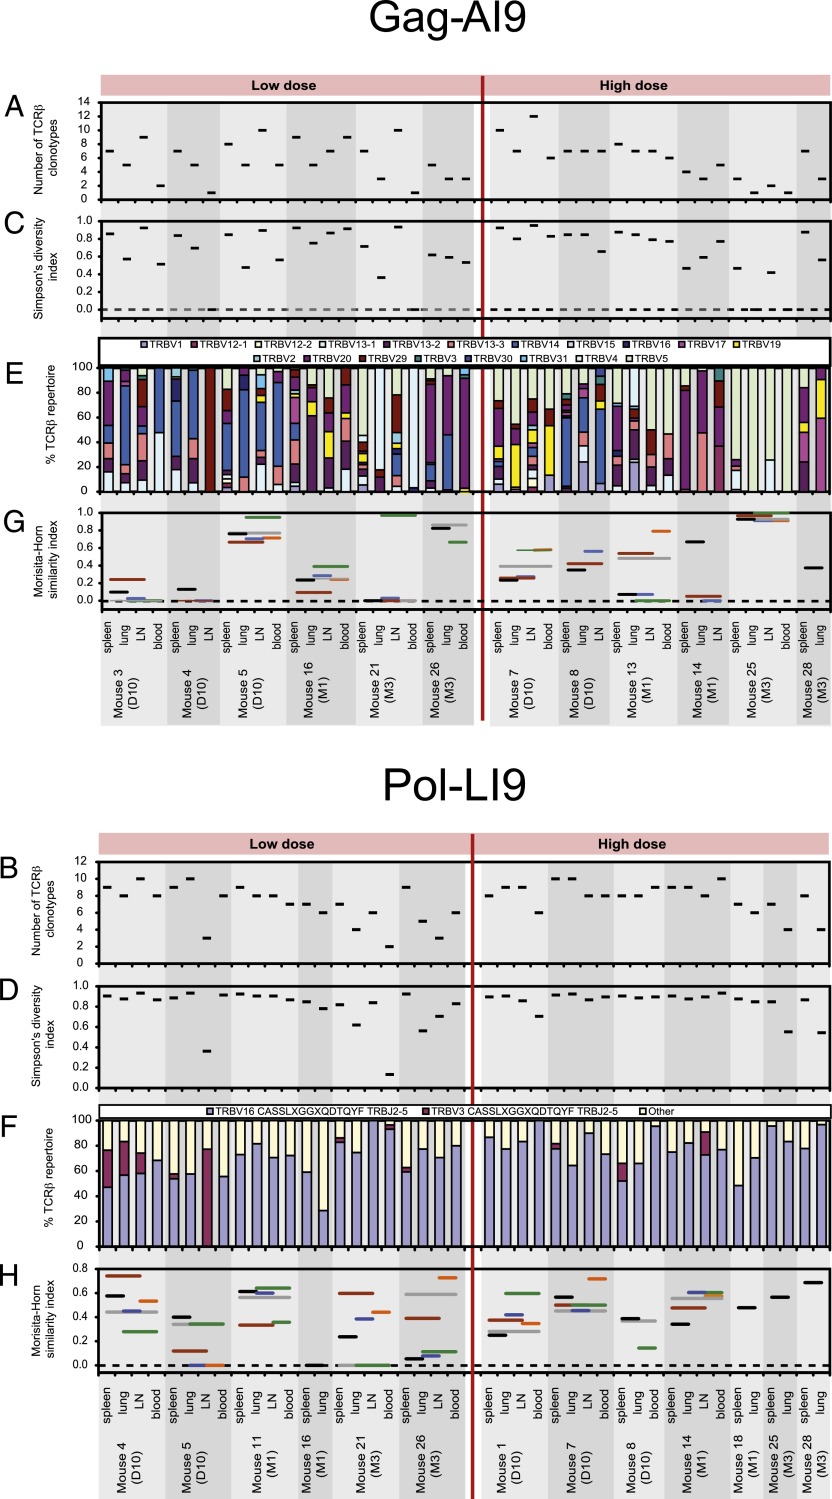
FIGURE 3.
Characteristics of TCRβ repertoires specific for Gag-AI9 and Pol-LI9. The diversity of Ag-specific TCRβ repertoires was assessed using the number of different TCRβ clonotypes (A and B) and Simpson’s diversity index (C and D). (E) The percentage of each TRBV is represented per mouse for Gag-AI9–specific TCRβ clonotypes. (F) The extent to which Pol-LI9–specific TCRβ repertoires conformed to the CASSLXGGXQDTQYF amino acid motif is shown per mouse, where TCRβ sequences with a CDR3β length of 15 aa used either TRBV16 or TRBV3 and TRBJ2-5. (G and H) The degree of overlap between TCRβ repertoires sampled from spleen, lung, lymph node (LN), and blood was assessed using the Morisita-Horn similarity index. The index value on the vertical axis of each horizontal line extending between two different tissues represents the similarity between those two tissues. The Simpson’s diversity and Morisita-Horn similarity indices account for both the number of different TCRβ clonotypes and the clonal dominance hierarchy and vary in value between 0 (minimal diversity/similarity) and 1 (maximal diversity/similarity). The number of clonotypes, Simpson’s diversity index, and the Morisita-Horn similarity index were estimated for all samples having an equal sample size of 15 TCRβ sequences. Analyses are shown for samples with at least 15 TCRβ sequences and only for mice with spleen and lung samples that both yielded at least 15 TCRβ sequences.

