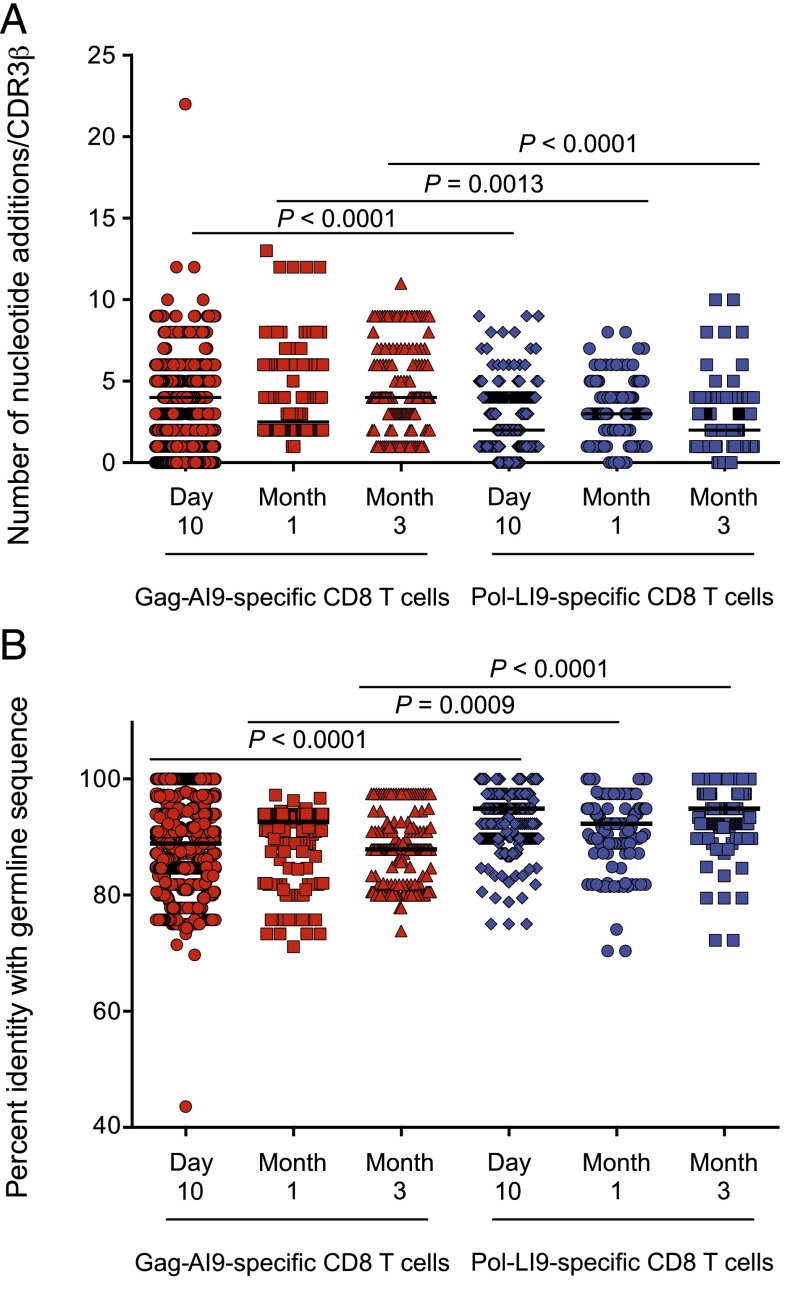
FIGURE 4.
Nucleotide addition analysis and determination of percent identity with germline sequence. Comparison of nucleotide additions (A) and percent identity with germline sequence (B) between Ag-specific TCRβ repertoires at each time point after vaccination. Statistical analyses were performed using the Wilcoxon matched-pairs signed-rank test; p values are shown for significant comparisons between specificities at equivalent time points. Error bars represent the SD in each analysis.

