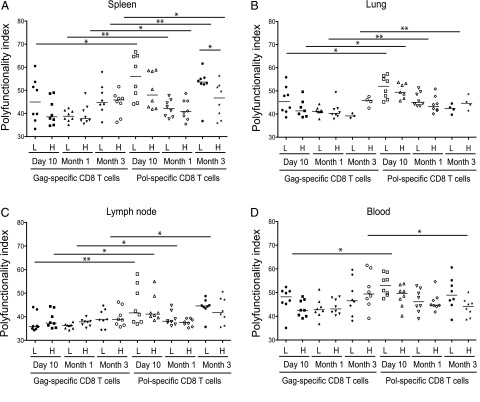
FIGURE 5.
Functional analysis of Ag-specific CD8 T cells after vaccination. The polyfunctionality index was calculated for Gag-AI9–specific and Pol-LI9–specific CD8 T cell responses in spleen (A), lung (B), lymph node (C), and blood (D) after vaccination with either low-dose (L) or high-dose (H) Ad5.Gag.Pol as indicated. Intracellular cytokine staining was performed for IFN-γ, TNF, and IL-2 after peptide stimulation ex vivo. Boolean gate arrays were created using the FlowJo platform to determine the frequency of each of the eight possible response patterns per cell. Nonspecific background events were subtracted from responses measured in the stimulated samples for each response pattern individually. Statistical analyses were performed using the Wilcoxon matched-pairs signed-rank test. Significant comparisons are denoted as follows: *p < 0.05, **p < 0.01.

