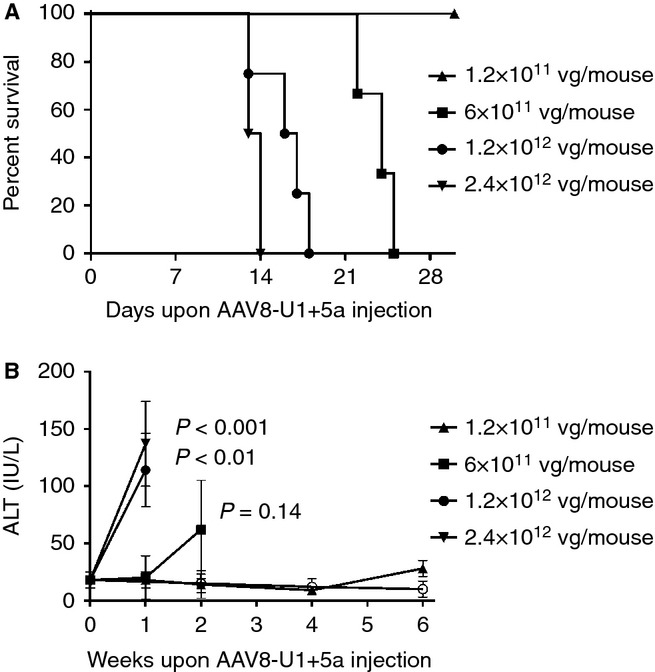
Figure 4.

Kaplan–Meier survival curves (A) and ALT levels (B) in relationship with the AAV8-U1+5a dose injected. Mice (n = 2–4 per group) were injected with AAV vector by the intravascular route at day 0. The vector doses per mouse are indicated. The open circle in panel B indicates mice injected with 6 × 10¹² vg per mouse of AAV2-FVII+5A and 1.2 × 10¹¹ vg per mouse of AAV8-U1+5a. The P values refer to statistical differences from a given ALT value and the baseline values. ALT, alanine aminotransferase enzyme.
