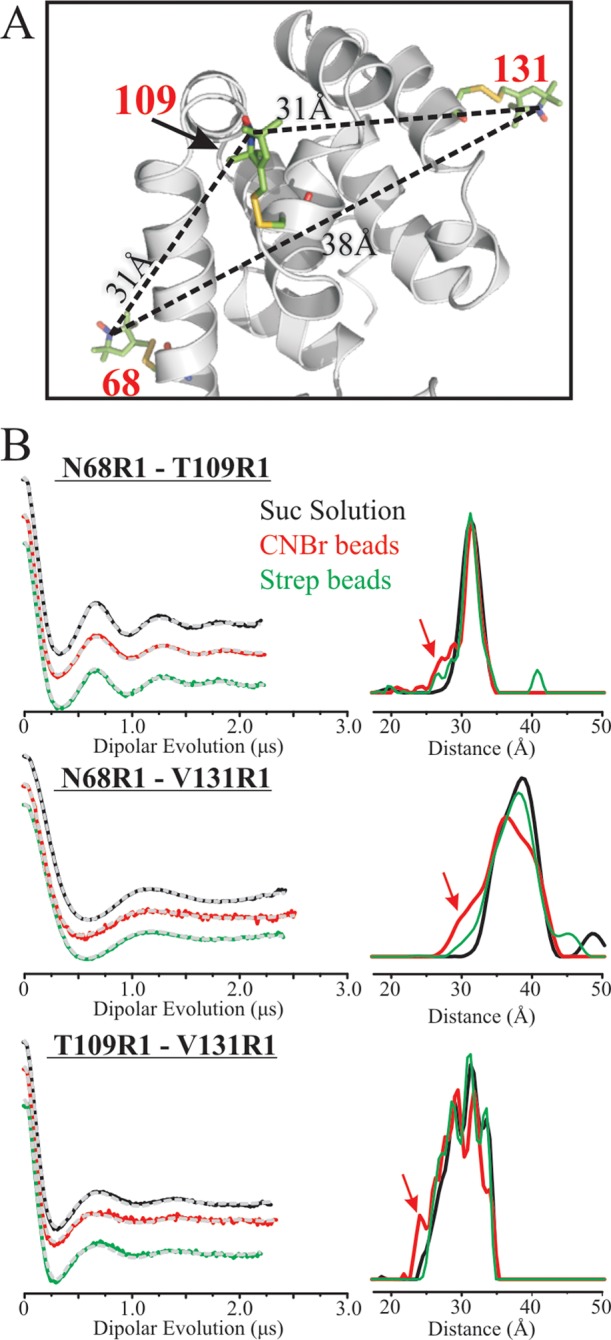
Figure 5.

Interspin distance measurements within the C-terminal domain of T4L in solution and tethered to beads. (A) Ribbon diagram showing the distances measured along with the expected values based on modeling. (B) Background-corrected DEFs (left panel) and corresponding distance distributions (right panel) for the indicated R1 doubles in solution (black), tethered to CNBr-Sepharose (red), and tethered site-specifically via site 44p-AzF and scheme 3 (green) are shown. The dashed gray traces are the best fit of the DEF. The red arrows identify an increase in the distance probability due to random attachment compared to solution and site-specific attachment.
