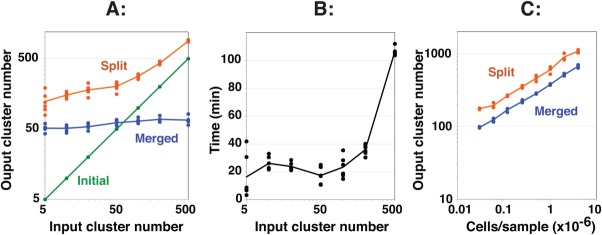
Figure 3.

Performance characteristics of SWIFT including robust convergence on a final cluster number. A single sample of influenza-stimulated human PBMC was analyzed by ICS and flow cytometry, and then a random subset of 100,000 cells was clustered in SWIFT using seven fluorescence and two scatter dimensions. (A) Different values of the input cluster number were used in the first step (six replicates per point). The numbers of clusters found after the first (Initial, green), second (Split, orange), and third (Merged, blue) steps are shown. (B) Run times for the analyses in A are shown. Analysis was performed on a 2.4 GHz Mac Pro with 8 cores. (C) Samples containing different cell numbers, randomly sampled from a concatenate of influenza-stimulated human PBMC samples, were analyzed in triplicate in SWIFT using 100 input clusters. [Color figure can be viewed in the online issue, which is available at wileyonlinelibrary.com.]
