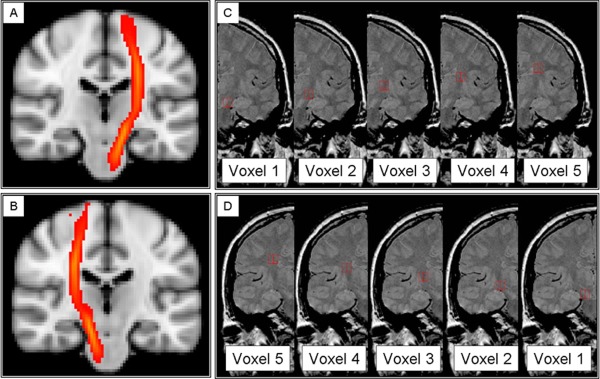
Figure 2.

Voxels extracted from the spectroscopic grid to obtain concentrations of metabolites along the cortico‐spinal tract. (A and B) Probability map of the left and right cortico‐spinal tracts, provided by the JHU white matter tractography atlas (http://www.fmrib.ox.ac.uk/fsl), which were used, together with the individual T1 images, as reference images to identify and position the voxels along the CST. (C and D) Spectroscopic voxels (in white, 1 = cerebral peduncle, 2 = above cerebral peduncle, 3 = internal capsule, 4 = above internal capsule, 5 = corona radiata) selected in the left (C) and right (D) white matter in regions where the CST is known to be located, from the cerebral peduncle to the corona radiata, overlaid onto coronal PD images.
