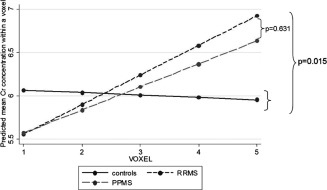
Figure 4.

Differences between patients and controls in the slope of Cr along the CST. Both groups of patients showed a significant increase of Cr concentration (in mmol/l) towards the upper parts of the CST (for RRMS: P = 0.007; for PPMS: P = 0.017), whereas controls did not show such increase (P = 0.791). The slope of Cr significantly differed between patients and controls (P = 0.015), whilst it did not change between RRMS and PPMS (P = 0.631).
