Fig. 3.
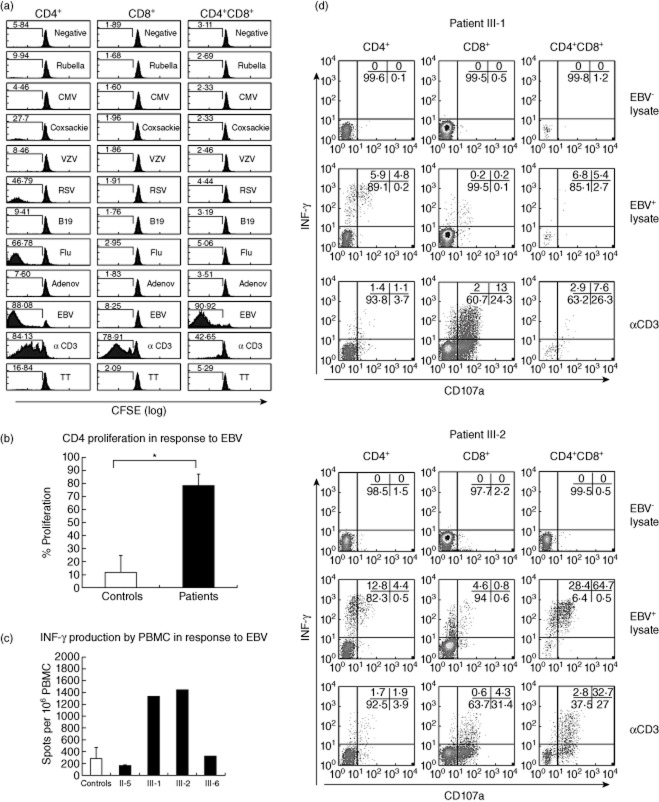
Epstein–Barr virus (EBV)-specific T cell responses in X-linked inhibitor of apoptosis (XIAP)G466X patients. (a) Proliferation of lymphocytes from patient III-2 in resting (negative) or stimulated conditions with different viral antigens. Numbers indicate percentages of cells with decreased carboxyfluorescein succinimidyl ester (CFSE) staining. A representative example of one of two independent blood samples is shown. (b) Comparison of EBV-induced proliferative responses between patients III-1 and III-2 and a group of 23 EBV+ age-matched healthy carriers. The percentage of cells with decreased CFSE staining in response to the EBV+ lysate minus the percentage in the negative conditions is indicated. (c) Ex-vivo interferon (IFN)-γ release in response to 6 h stimulation with an EBV+ cell lysate in patients in comparison to a normal control group. Results represent the number of spots per 106 cells after subtracting the spots identified with an EBV− cell lysate. The means of two independent blood samples from each of the patients are included in the analysis and a cohort of 41 age-matched controls used for comparison. (d) Ex-vivo IFN production and cytotoxic degranulation (CD107a membrane expression) in peripheral blood mononuclear cells (PBMCs) in response to 6 h stimulation with an EBV− cell lysate (negative control), EBV+ cell lysate or anti-CD3–CD28–CD2 coated beads (positive control) in patients III-1 and III-2. Numbers in each quadrant indicate percentage of cells calculated within each T cell subpopulation. A representative example from one of three independent blood samples obtained within a year is shown for each patient.

