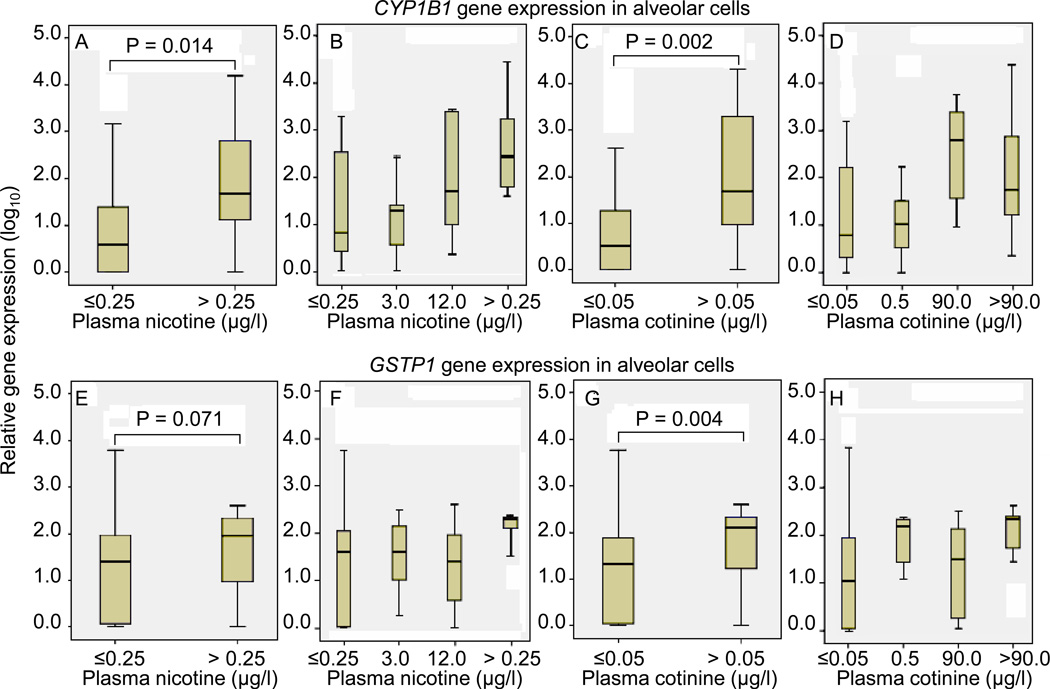
Figure 2.
Box plots for the relative mRNA expression of CYP1B1 and GSTP1 in microdissected alveolar cells (AC) associated with the plasma nicotine and cotinine levels. The Mann-Whitney test was used for testing the differences in median gene expression across the categories of the plasma nicotine and cotinine levels. The vertical axis is log10, such that a range from 0 – 4 relative units represents a 10,000-fold range. Figure 2C, D, and G, H resolve the tobacco exposure further, depicting the significant variance in expression in CYP1B1 and GSTP1, respectively, in finer categories of plasma nicotine and cotinine.

