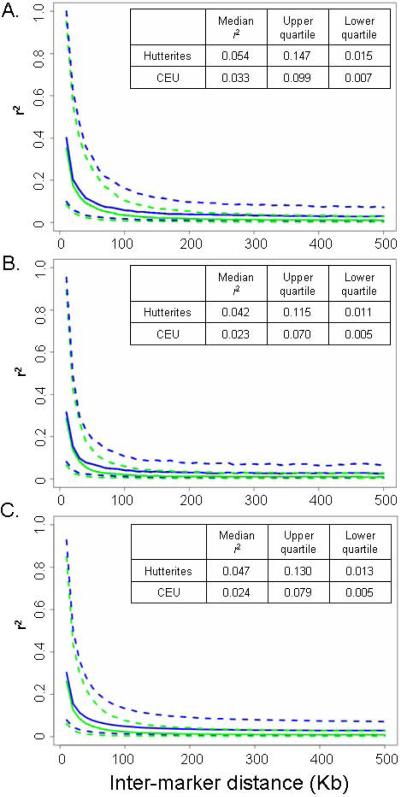
Figure 2.
Comparison of LD (measured using r2) in CEU (blue lines) and Hutterites (green lines). Solid lines correspond to median values and dotted to upper and lower quartiles. Inter-marker distance (Kb) is shown on the X axis. Pairwise LD values between markers on chromosomes 2q (A), 21q (B), and the whole genome (C), are plotted. r2 values in inset tables are calculated based on all SNP pairs in 10 Kb windows.

