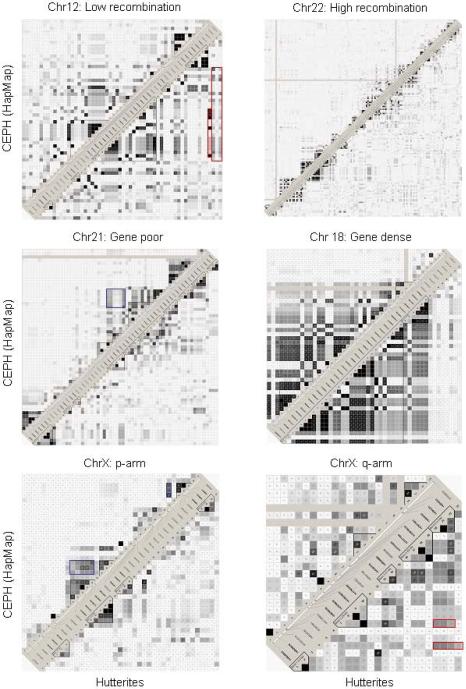
Figure 3.
Comparisons of LD between SNPs in 500 Kb regions in 60 CEU and 60 Hutterite individuals. Hutterite data appear on the lower right and CEU on the upper left of each panel. Examples of regions that show greater LD in Hutterites or CEU are boxed in red or blue, respectively (see Results). Solid gray lines extending the length of the region in the HapMap samples indicate missing data. The genomic coordinates for the six regions can be found in Table S1.

