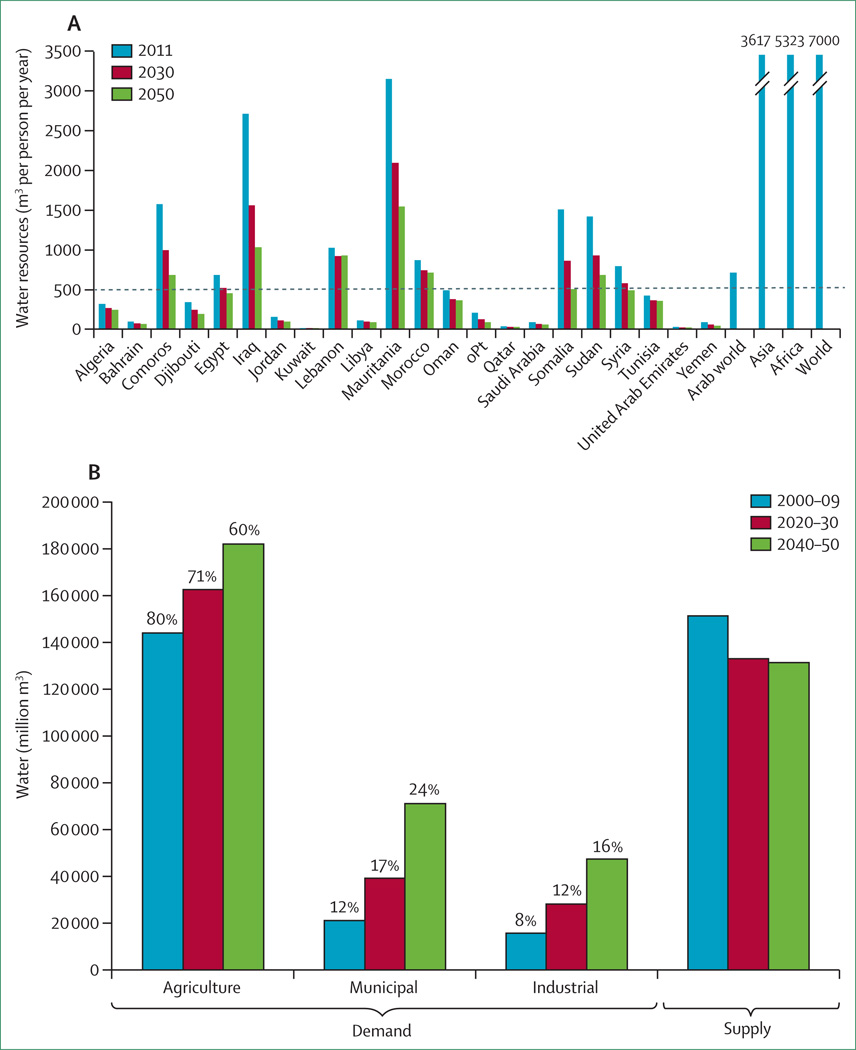
Figure 3. Change in water resources, 2011–50, and water scarcity and water demand by sector in the Arab world.
(A) Current and projected total renewable water resources per person in 2011, 2030, and 2050 per Arab country, and total renewable water resources per person in 2011 in the Arab world, Asia, Africa, and worldwide. The horizontal dashed line shows the absolute water poverty limit (500 m3 per person per year). Data for 2011 are from AQUASTAT16 and data for 2030 and 2050 are from the authors′ own calculations using AQUASTAT16 and data from the UN Department of Economic and Social Affairs.17 (B) Current and projected water supply, and demand by sector, for 2000–09, 2020–30, and 2040–50 in the Arab world; percentages show the water demand per sector as a proportion of total demand. Data are from Assaf and colleagues.18 oPt=occupied Palestinian territory.

